“How do I set 75% power?” It’s a common question seen on e-mail lists and web forums. This is an important question, with no easy answer. The engine break-in procedures recommended by engine manufacturers specify desired power settings for the break-in period. We also need to know engine power when doing cruise performance flight testing. The POHs for type-certificated aircraft all contain useful power setting charts, but amateur aircraft builders have to roll their own power charts. This article will discuss some commonly used ways to determine engine power, and it will then present a way to accurately determine the power of Lycoming engines via post-flight analysis of fuel flow data.
Engine Manufacturer Power Charts
The power charts provided by manufacturers of type-certificated engines are the gold standard when determining engine power, but these charts have significant limitations that we must understand. The limitations should be listed on the margins of the charts—read them carefully. The limitations, stated or implicit, are:
1. The mixture must be set for best power.
2. The chart power is for standard temperature. If the temperature is above or below standard, the temperature corrections listed on the chart must be applied.
3. The chart power is for dry air. If the air is humid, power will be reduced.
4. The engine configuration must match that of the engine model listed on the chart. Any changes in compression ratio, ignition system, or fuel delivery system may affect the power produced.
5. The engine must be in good condition. An engine with low compression, leaky valves, weak ignition system, etc. won’t make the power claimed by the chart.
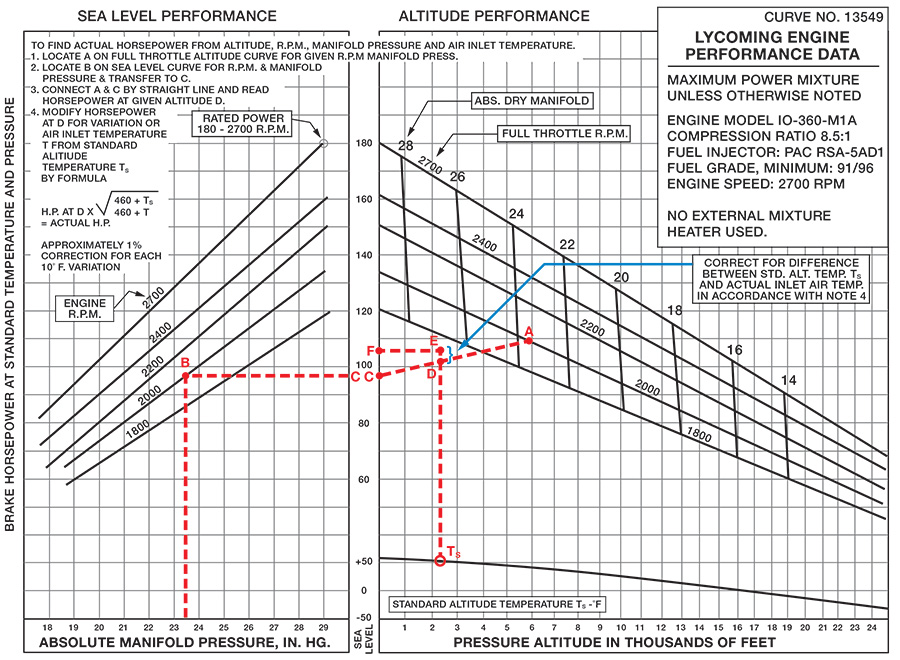
Figure 1: Lycoming IO-360-M1A power chart (simplified for illustrative purposes).
Engine manufacturer power charts can be very daunting when you first look at them. Don’t let all those lines spook you. If you can learn to build an aircraft, you can learn to read a power chart—it isn’t rocket science. Even a fighter pilot can learn to read power charts (that was a joke—fighter pilots don’t need power charts, as they only use two throttle positions—full afterburner and idle).
Figure 1 shows a cleaned-up version of the power chart for a Lycoming IO-360-M1A series engine. If you have such an engine, you can find the chart in the engine Operator’s Manual that you should have received with your engine. The left side of the chart shows the power that is produced at sea level at standard temperature, as a function of rpm and manifold pressure (m.p.). The right side of the chart provides power at full throttle as a function of rpm and m.p. at various altitudes.
For this example, let’s determine the power produced with mixture set for best power at 2000 rpm and 23.6 inches m.p. at 2300 feet pressure altitude at 14 F (-10 C). Start on the right side of the graph, which shows various combinations of full-throttle manifold pressure vs. rpm at standard temperature. Find the 2000 rpm line, and then interpolate between the 22- and 24-inch lines to find the power for 23.6 inches m.p at 2000 rpm, which is labeled as Point A in the example on the chart. Look to the left to find 109 hp. If you go straight down, you see that this combination of rpm and manifold pressure is predicted to occur at full throttle at about 5900 feet.
Now go to the left side of the chart, which shows the power produced at sea level, at standard temperature. Point B in the example indicates 2000 rpm and 23.6 inches m.p. Look to the right to see that this power setting would produce 97 hp at sea level with standard temperature. Now we know what power would be produced at 2000 rpm and 23.6 inches at sea level, and also at 5900 feet. The next step is to interpolate to find what power would be produced at 2300 feet.
Take the 97 hp point from the sea level chart on the left, and mark it on the right chart. This is Point C. You’ll see it at the left edge of the portion of the chart that shows sea level on the scale at the bottom.
Draw a straight line from Point C (97 hp at sea level) to Point A (109 hp at 5900 feet). Find 2300 feet on the scale on the bottom, and go up from there to see where that altitude intersects the line you just drew—102 hp (Point D in the example). This is the predicted power at 2000 rpm and 23.6 inches m.p. at standard temperature, in dry air, at 2300 feet pressure altitude.
Note: If your aircraft has a very efficient air filter/air box design and a high cruise speed, you may find that the m.p. at full throttle is higher than what is shown on the right side of the power chart. In that case, the straight line between Points C and A would be extended, farther up and to the right, and Point D would be to the right and upwards from Point A.
Temperature Correction
Some of the Lycoming power charts have a line at the bottom of the right half of the chart showing standard temperature (TS) as a function of altitude. Find 2300 feet, go up to the line, then over to the scale on the left. You’ll see that the standard temperature is 51 F (10.4 C). Note 4 at the top left of the chart provides two ways to correct for non-standard temperature.
The temperature correction formula in Note 4, which assumes temperatures are in degrees Fahrenheit, is:
P = PS * SQRT ( 460 + TS / 460 + T ) [temperatures in ˚F]
If using degrees Celsius, the formula would be:
P = PS * SQRT ( 273.15 + TS / 273.15 + T ) [temperatures in ˚C]
Where
P = power at actual temperature
PS = power at standard temperature from power chart
T = actual temperature
TS = standard temperature
Note 4 also gives a temperature correction of “approximately 1% correction for each 10 F variation from TS.” The actual temperature in our example (14 F) is 37 F colder than the standard temperature of 51 F. The correction is 1% for every 10 degrees, so we have a correction of 3.7% of 102 hp, or 4 hp. The predicted power is 102 + 4 = 106 hp, in dry air. This 4-hp temperature correction is shown at Points E and F.
Engine Power Spreadsheets: It is possible to create spreadsheets that emulate the typical power charts. Engine power chart spreadsheets for the Lycoming O-360-A-C, IO-360-A,-C & IO-540-D, -N, -R, -T &-V are available at the links listed in the Online Resources section at the end of this article.
Humidity Correction
Water vapor in the air, i.e., humidity, displaces the other constituents. The lower oxygen content means less fuel can be burned, so less power is produced. The manifold pressure lines on the Lycoming power charts are for “dry manifold pressure,” i.e., they are valid for completely dry air. In the real world, with some amount of humidity, the manifold pressure must be corrected before entering the power chart.
The amount of water vapor in the air can be determined from the dewpoint. The tables below provide the correction that must be applied to the m.p. for various dewpoint values. For example, if the dewpoint is 59 F (15 C), and the manifold pressure is 29 inches, the correction is -0.5 inches, thus we would use a m.p. of 28.5 inches when using the power charts.
The dewpoint cannot be higher than the air temperature, and air temperature generally decreases as the altitude increases. Thus there is normally less water vapor present at altitude than at ground level. If the air is cold enough, the amount of water vapor it can hold is so small that the effect on power is negligible. At 18 F (-8 C) even fully saturated air has a vapor pressure of only 0.1 in Hg, which is likely smaller than the error in our m.p. gauges.
We can determine ground-level dewpoints from reported airport weather observations. Dewpoints at altitude are harder to find—the best source is upper air sounding data from weather balloons, available at many locations over the Internet. The University of Wyoming web site has data from many locations around the world.
Rather than correcting the m.p. before using the power chart, the actual m.p. may be used to calculate the power, then the following approximate correction may be applied:
P = Pdry * (( (m.p. – PH2O) / m.p. ) – 0.17) / (1 – 0.17)

Humidity Correction Table (C)
Where
P = power in humid air
Pdry = power in dry air, from power chart
m.p. = actual manifold pressure
PH20 = M.P. correction from tables below
The water vapor pressure and the approximate power correction for humid air may also be determined using the Humidity Correction Spreadsheet listed in the Online Resources.
Effect of Compression Ratio
Some builders install higher compression pistons in their engines to obtain increased power. Compression ratio is one of the major factors that determines the thermal efficiency of internal combustion engines. The higher the compression ratio, the greater the amount of power that will be produced from the combustion of a given amount of air and fuel. Engine manufacturer power charts are only valid if the compression ratio is as specified for the engine model listed on the chart. If we have changed the compression ratio of our engine, we can make approximate corrections to the power from the power chart, using the theoretical relationship between efficiency and compression ratio.
P2 = P1 * ( 1 – CR2-0.27 ) / ( 1 – CR1-0.27 )
Where
P1 = power with original compression ratio
P2 = power with new compression ratio
CR1 = original compression ratio
CR2 = new compression ratio
For example, if we had a 150-hp O-320, with a 7.0:1 compression ratio, and we installed 8.5:1 compression ratio pistons, the predicted power with the higher compression ratio pistons is:
P2 = 150 * ( 1 – 8.5-0.27 ) / ( 1 – 7.0-0.27 ) = 161
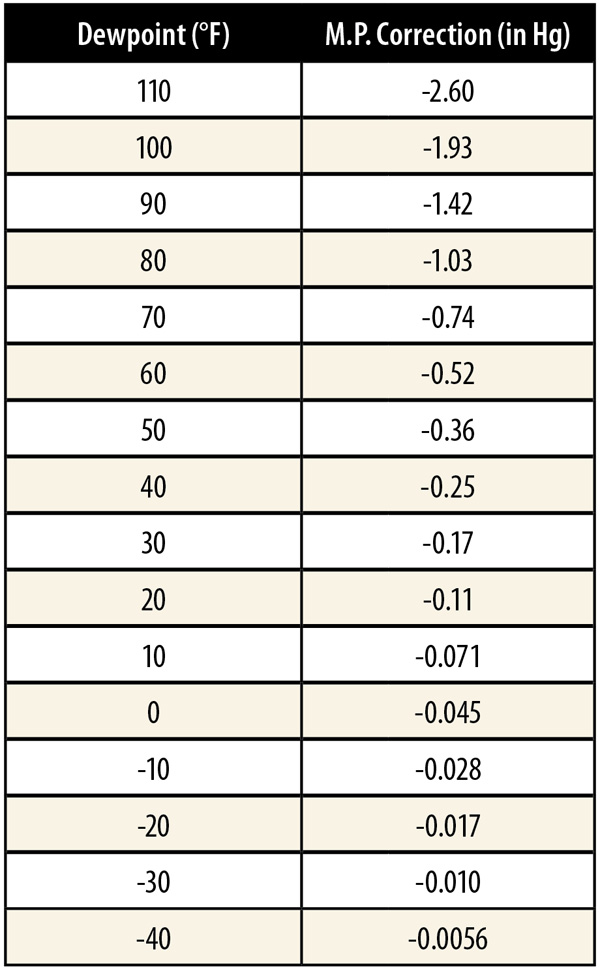
Humidity Correction Table (F)
Pilot Operating Handbooks
We can also look at power charts in POHs for type-certificated aircraft, but they are only useful for aircraft with constant-speed props. If we have a fixed-pitch prop, we cannot use the logic of, “On the Cessna 172, XXXX rpm gives 75% power, so that should work on my aircraft, too.” In fact, if we desire a certain rpm, the manifold pressure needed to achieve that rpm will vary significantly depending on the prop pitch, how much drag our aircraft has, etc. The amount of power produced varies as the manifold pressure varies. Using rpm to set power works on type-certificated aircraft because the manufacturer has done testing to determine how much m.p. will be required to produce a given rpm, once stabilized in level flight. This is possible because they know which prop will be installed and how much drag the aircraft has.
Although most type-certificated aircraft with fixed-pitch props do not have manifold pressure gauges, they can be very useful. For example, after reaching cruise altitude, it is much easier to set power using a m.p. gauge than it is to set it with rpm, as the rpm changes as the airspeed changes, but the m.p. is almost constant, changing little as the speed changes. The presence of a m.p. gauge also allows power to be determined using power charts.
Rule of Thumb of RPM/100 + Manifold Pressure
Some flyers with Lycoming engines use a rule of thumb based on rpm and m.p. to determine power settings to give a desired percent power. According to this often quoted, very simple rule of thumb, if the rpm in hundreds and the m.p. in inches of mercury add up to 48, then you are at 75% power. E.g., 2500 rpm and 23 inches m.p., is 25 + 23 = 48. If the sum is 45, that is 65% power, and a sum of 42 supposedly gives 55% power.
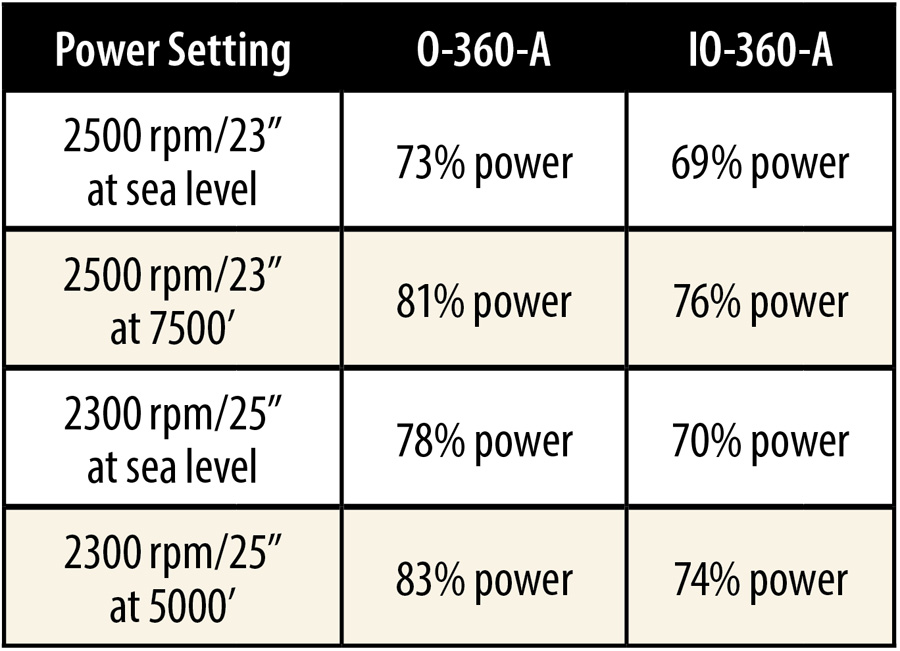
This would be a wonderfully nice rule of thumb, if it worked. The problem is that the power charts show if we hold rpm and m.p. constant, the power varies as we change altitude. Power also varies with temperature, and the relationship between rpm and power is different between angle-valve and parallel-valve Lycomings. So any rule of thumb that ignores altitude, temperature, and engine model is going to have errors. For example, consider the power produced, according to the Lycoming power charts, for O-360-A and
IO-360-A at various rpm and m.p. that gives the sum of 48.
Fixed-Pitch Prop
Many folks building aircraft with fixed-pitch props don’t install a m.p. gauge, as they are not strictly needed to fly the aircraft. This works OK on type-certificated aircraft, as the manufacturer knows what exact engine model and propeller the aircraft is fitted with, and has done the flight testing to determine how much m.p. it takes to stabilize at a desired rpm in cruise. Knowing the relationship between m.p., rpm, and speed for that aircraft/engine/prop combination, the manufacturer created a chart showing what rpm you need to set to achieve a desired power setting. This works OK on type-certificated aircraft, where all aircraft of each model are essentially identical. But, each amateur-built aircraft is essentially unique, so the rpm that produces a given power on one aircraft will be all wrong on a different one. But if you had the foresight to install a m.p. gauge, you have the info you need to use the power chart.

Power charts can definitely make your head hurt. But once you get the hang of it, determining engine power is easier than you think.
Approximate Calculation of Power from Fuel Flow
If we are running at mixture for peak power, the brake specific fuel consumption (BSFC) should be on the order of 0.5 pound/hp per hour, if the engine compression ratio is 8.5:1 or 8.7:1, or roughly 0.54 pound/hp per hour if the compression ratio is 7.0:1. Avgas weighs about 6 pounds/gallon, so we would expect about 12 hp for every one gph of fuel flow if the compression ratio is 8.5:1. A fuel flow of 10 gph implies a power of 120 hp, if running at mixture for best power, or 66% power if it is a 180-hp engine. If the engine has a compression ratio of 7.0:1, the power produced with mixture for best power is approximately 11 hp for every one gph of fuel flow.
If we are running lean of peak EGT, the BSFC should be on the order of 0.4 pound/hp per hour. We can get a very approximate power by multiplying the fuel flow in gph by 15.
Lycoming Power from Fuel Flow
Many years ago, engineers at Lycoming developed a method to determine engine power based on fuel flow data (the original source document is available at the link listed in the Online Resources section). This method, valid for mixtures both rich and lean of peak EGT, was intended as a means to determine the power during steady-state conditions during flight testing (constant altitude, rpm, m.p., fuel flow, etc.), using post-flight analysis of hand-recorded data. It is not suitable for real-time use in flight, nor is it suitable for determining engine power during dynamic conditions, such as takeoff or climb.
This method requires accurate fuel-flow indications, rpm, and a four-cylinder EGT. It requires sustained operation at peak EGT, so it is not suitable for high-power conditions. The method calculates the power developed in the cylinders, then subtracts the power lost to friction. Testing on the author’s aircraft has shown good correlation between calculated power and speed over a wide range of fuel flows, so the method does appear to produce the correct variation of power with mixture, both rich and lean of peak EGT.
First, develop repeatable leaning techniques for ROP and LOP operations, and proposed power settings (rpm and m.p. vs. altitude) for cruise flight. Then, conduct cruise power flight tests, setting rpm and m.p, then adjust mixture to peak EGT. Record rpm, m.p., and fuel flow at peak EGT, altitude and OAT. Then, without moving the throttle or prop controls, adjust mixture to the desired ROP or LOP setting and record fuel flow.
Post flight, calculate the power at each test point based on the fuel flows, using the spreadsheet listed in the Online Resources. Finally, revise the proposed cruise power settings table as required to come closer to target percent powers. Repeat the process until the table of cruise powers results in the intended target percent power.
Fuel Flow Indicator Calibration: The accuracy of this method is only as good as the accuracy of the fuel flow indicator, so particular care must be taken to adjust the fuel flow meter calibration constant. To calibrate the fuel flow indicator, fill the fuel tanks. Then record the fuel used on each flight, as measured by the fuel flow system, and the amount of fuel added. Total both values over many flights and compare them. Keep adjusting the fuel flow meter calibration constant until the indicated fuel used over 10 hours of flying is within 1% of the fuel added after those flights. It isn’t good enough to do this over individual flights, as it is difficult to fill the tanks to the exact same level every time. See the Online Resources section for a spreadsheet to calculate adjustments to the fuel flow meter calibration constant.
EFIS Power Display
Many modern EFISes can be configured to display engine percent of rated power. The early implementations relied on the user input of tables of rpm, m.p., altitude, and power pulled from power charts, and thus would only be valid when running at mixture for best power. Some modern EFISes have thrown fuel flow into the power calculation, and attempt to discern whether the engine is running ROP or LOP.
It is impossible to know how accurate the EFIS percent power display is without conducting some flight testing. The following suggested test program could be used to evaluate the accuracy of the displayed percent power:
1. Carefully calibrate the fuel flow indication, over several flights, as described above.
2. Set rpm and m.p. for a power setting of approximately 75%.
- Set mixture for best power.
- Record rpm, m.p., altitude, OAT, and EFIS percent power.
- Repeat with other rpm, m.p., and altitude combinations giving approximately 75% power.
- Post flight, use the engine manufacturer’s power chart to determine the power for each of the test points, including any OAT correction, and compare to the EFIS percent power.
3. Set rpm and m.p. for a power setting of approximately 65%.
- Set mixture for peak EGT.
- Record rpm, m.p., fuel flow, altitude, OAT, and EFIS percent power.
- Set mixture for best power and record the same data items.
- Set mixture LOP, if the engine will run smoothly, and record the same data items.
- Repeat with other rpm, m.p. and altitude combinations giving approximately 65% or less power.
- Post flight, use the engine manufacturer’s power chart to determine the power for each of the test points with mixture for best power, including any OAT correction, and compare to the EFIS percent power. If the aircraft has a Lycoming engine (or clone), use the Lycoming Power from Fuel Flow method to calculate power at each condition, and compare to the EFIS percent power.
Power vs. Density Altitude
Many pilots assume that power varies exactly with density altitude, and they will carefully choose the test altitude to achieve a target density altitude for the test. However, if we test various combinations of conditions in manufacturer power charts, we see that power does not vary exactly with density altitude. For example, let’s look at two conditions 10 C warmer and cooler than standard temperature, with a density altitude of 7500 feet. The pressure altitudes and OATs are 8715 feet/-12.3 C and 6340 feet/+12.4 C. We have a fast aircraft, with an efficient air induction system, and we normally achieve a cruise manifold pressure that equals the ambient pressure. Thus our m.p. would be 21.6 inches at 8715 feet, and 23.7 inches at 6340 feet, and we are using 2300 rpm. The O-360-A power chart, corrected for the non-standard temperatures, predicts power of 139.9 hp (77.7%) at 6340 feet, and 133.3 hp (74.1%) at 8715 feet. The differences in power between these two conditions will result in the TAS differing, even though the density altitude is the same. This raises the obvious question of how one would conduct cruise performance testing in real world conditions where the temperature is not the same on every day. This problem will be considered in a future article focusing on cruise performance testing.
Conclusion
Enough rambling about power. Engines stop! Now you can sharpen your pencils and impress your friends with your prowess picking off powers to the second decimal place from those engine power charts. Hopefully you are one of the lucky ones with an engine whose power chart has nice sharp lines, rather than the too-many-times-copied fuzzy lines you find in some power charts.


There’s nothing more confusing than this chart, the explanation and the whole length of the explanation.
It’s easy to understand why we have so many pilots crashing airplanes nowadays.
Holly Molly!
LOL