As amateur builders we are fortunate to have a plethora of propellers to choose from. Various types such as fixed-pitch, ground-adjustable, and constant-speed propellers are readily available from several manufacturers. The number of choices increases when you consider construction material and blade number variations as well. The arguments for fixed-pitch propellers usually revolve around simplicity, lower weight, and cost. The arguments for constant-speed propellers are usually focused on better performance across a wide range of aircraft and engine speeds. Plenty of good articles have already covered this ground, so we won’t go there now. This article assumes you have already installed a constant-speed propeller.
Now that you have a constant-speed propeller, an obvious question arises: What is the best rpm to choose? This is not an easy question to answer because it depends on your definition of “best.” Also complicating the matter is the fact that there are literally an infinite number of rpm to choose from. What makes 2350 rpm better or worse than, say, 2561.3 rpm? This article describes a few tests I conducted to help me choose the best rpm in my RV-8.
Some factors that may affect your choice of propeller rpm are: speed, efficiency, noise, vibration, and operating limits.
Lets tackle vibration first. The advent of affordable propeller balancing systems means that there really isn’t a good excuse not to get a dynamic propeller balance done. The RPX Technologies DynaVibe propeller balancer I recently used took only two hours and three iterations from start to finish. The DynaVibe allowed the operator to improve vibrations from a fair 0.16 inches per second (IPS) to an excellent 0.03 IPS at 2500 rpm. Every part of your aircraft will be happier and last longer when vibrations are minimized. Even so, a dynamic balance is normally done at a single engine speed. When choosing a propeller rpm for sustained operations like climb and cruise, you want to pick one where the engine and propeller combination is smooth.
The noise level we are exposed to affects our comfort and performance in flight. If the combination of propeller diameter and rpm makes the tip speed close to the speed of sound, this will create a lot of noise. Excessive noise makes communication difficult and can result in long-term hearing damage to the pilots and passengers. Our aircraft noise also affects those on the ground, some of whom may be less enamored with aviation than we are. So choosing an rpm that minimizes noise should also be a consideration.
Whatever propeller rpm you choose needs to be within the manufacturer’s published operating limits. The upper rpm limit is usually to protect the propeller from excessive centrifugal forces, which increase with the square of the rpm. “Avoid regions” are usually a result of vibration or harmonics. For example the Whirl Wind 74RV propeller fitted to my RV-8 has a maximum rpm of 2700 rpm, and a maximum continuous rpm of 2600 rpm. There is an avoid range from 2050 to 2300 rpm. If I want my propeller to last, whatever rpm I choose has to take into account these limits.
Propeller rpm could also affect aircraft speed and efficiency. A theoretical advantage of the constant-speed propeller is that it has relatively constant efficiency over a wide range of engine and aircraft speeds. So from just the propeller standpoint, the choice of rpm should not make any difference. However, we need to consider the whole aircraft and not just the propeller. For example, if we reduce our engine speed, we reduce the internal friction and pumping losses. It is possible to make a given amount of power using high manifold absolute pressure (MAP) and low rpm or by using low MAP and high rpm. The high MAP and low rpm combination will do it with less fuel flow (i.e.; more efficiently). This would indicate that from an engine standpoint, choosing a lower rpm would be more efficient. This relationship can be seen in the Lycoming engine manual “Part Throttle Fuel Consumption” charts. Changes in in the rpm could also change the ignition timing if you have electronic ignition. Even if you have fixed-timing magnetos, a change in rpm will alter the crankshaft angle where the peak cylinder pressure occurs and subsequently the power and efficiency of the engine. To complicate the matter further, the airframe efficiency also has an input. If we choose a lower rpm, which results in less power and a lower airspeed, this could slow us below the best range speed. The reduction in airframe efficiency could then offset any increase in engine efficiency. I am sure with good modeling and simulation, you could take into account all the interrelated effects and figure this out. But where is the fun in that?
Test Method and Conditions
Instead of relying solely on theory, I decided to go fly my plane over a wide range of propeller rpm and see how it affected the cruise speed and efficiency. I did two flights, each two hours in duration. The data was gathered at 12,000 feet pressure altitude (a representative cruise altitude for me), where the OAT was 54 F (12 C). There was a temperature inversion at 10,000 feet, so the air was nice and smooth. I took off at 1500 pounds with a CG of 80 inches (forward). I tested from a high of 2600 rpm (maximum continuous rpm for my propeller) to a low of 1800 rpm (the lowest governing speed). I started with the high rpm and worked to the low rpm. As a result, the aircraft was heavier when conducting the high-rpm test points. The gap in the cruise data from 2050 to 2300 rpm was due to the avoid range of the 74RV propeller.
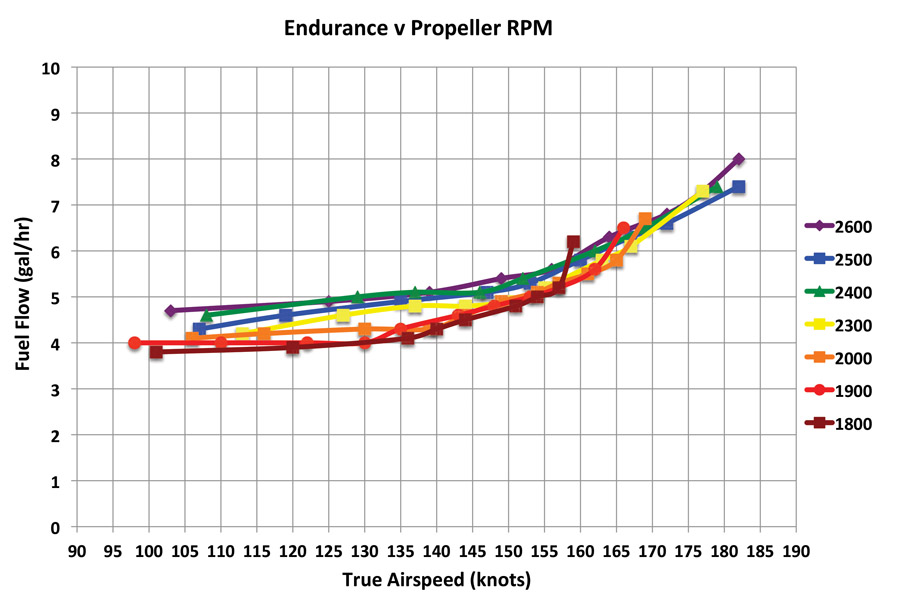
Endurance
The condition that results in the minimum fuel flow provides the maximum time aloft or endurance. You would fly at the endurance speed if you needed to hold, or you wanted to use the least amount of fuel possible but did not have to actually go anywhere. For the endurance test (and subsequent maximum range and cruise tests), I started with wide-open throttle (WOT) at the desired propeller rpm and leaned to 25 F (-4 C) lean of peak (LOP). From there I kept propeller and mixture constant and reduced the throttle to vary power and airspeed. By plotting the fuel flow against true airspeed (TAS), it was possible to determine the speed for maximum endurance and how changes in propeller rpm affected the fuel flow. In my plane the maximum endurance was achieved at 100 knots TAS, but the fuel flow changed very little from 100 to 120 knots TAS. This is good because it means that even relatively large airspeed errors do not incur a harsh fuel flow penalty. Lower propeller rpm resulted in lower fuel flow at the endurance speed. Flying with 1800 rpm used approximately 1 gallon per hour less than 2600 rpm at the same speed, a savings of over 20%.
Flying with 1800 rpm used approximately 1 gallon per hour less than 2600 rpm at the same speed, a saving of over 20%.
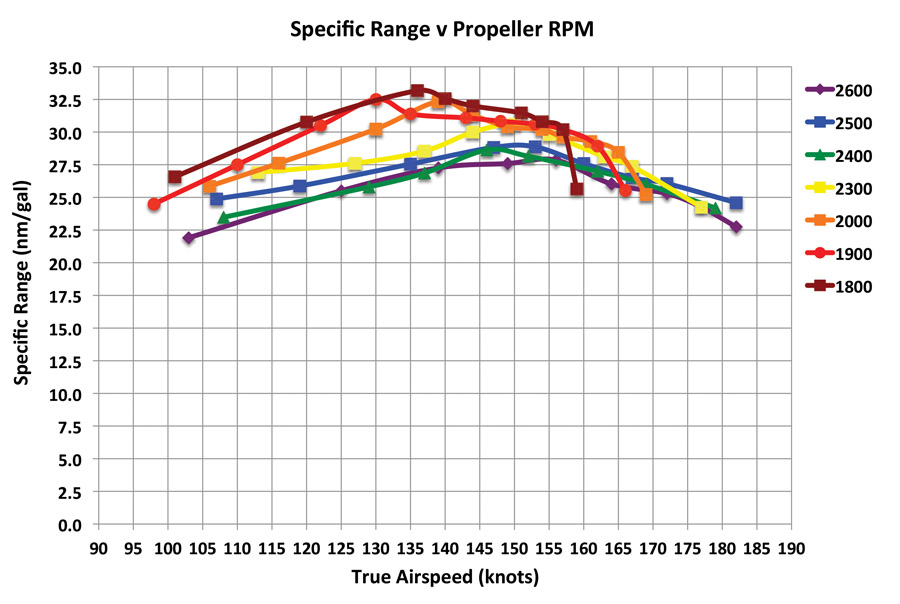
Range
The speed that results in the maximum distance per unit of fuel consumed is the best range speed. You would fly at the best range speed if you had a great distance to travel with only just enough fuel to do it, and you don’t care how long it takes. Best range speed is also how you would fly if maximum fuel efficiency were your highest priority. Dividing the TAS by fuel flow results in specific range (SR), or efficiency in nautical miles per gallon (nm/gal). By plotting the SR versus TAS, it is possible to see how the airspeed and variations in propeller rpm affect efficiency. In my aircraft the SR varied from 28 nm/gal at 2600 rpm and 155 knots TAS to 33 nm/gal at 1800 rpm and 135 knots TAS. Flying at 1800 rpm improved the maximum SR by 5 nm/gal (+19%) compared to 2600 rpm, albeit at a speed 20 knots slower.
Flying at 1800 rpm improved the maximum specific range by 5 nm/gal (+19%) compared to 2600 rpm, albeit at a speed 20 knots slower.
Cruise
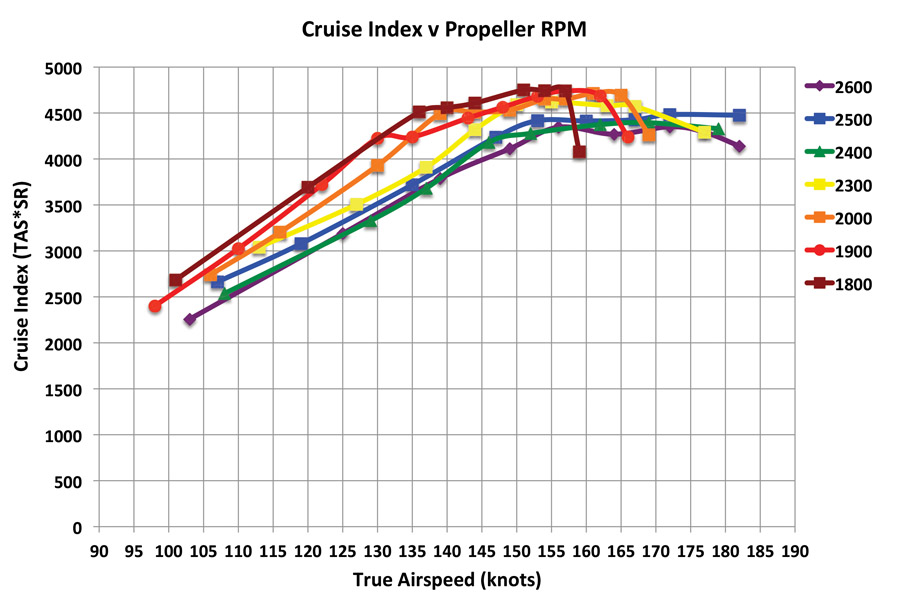
The best range speed will come in handy for that around-the-world flight, but it is pretty slow. The neat thing about airplanes is that they can go fast relatively efficiently. Imagine that you value your time (speed) and fuel efficiency (nm/gal) equally. This is the result if we maximize the product of TAS and SR. A cruise index is not a new idea. In 1980, B.H. Carson wrote a technical paper, Fuel Efficiency of Small Aircraft (http://tinyurl.com/yc4ula2g), which introduced the idea of maximizing the product of lift/drag and TAS. As a pilot, I have no L/D meter, and it has no direct cost, but fuel flow and fuel cost are easy to measure, so I prefer to use TAS * SR. The CAFE score is another variation on this theme. Feel free to make up your own cruise index using whatever ratios of TAS, SR, and payload suit your mission profile.
Using TAS * SR shifts the peak of the curves to the right, so the best cruise speed is faster than the best range speed. Also interesting to note is that the tops of the cruise index curves are quite flat. At the higher propeller rpm, the cruise index penalty for flying as fast as possible is quite small. In my aircraft the maximum cruise index varied from 4750 at 155 knots TAS with 1800 rpm to 4350 at 175 knots TAS with 2600 rpm. Flying with 1800 rpm resulted in a 9% improvement in the cruise index compared to 2600 rpm, albeit at a speed 20 knots slower. As an interesting comparison a Prius at 65 mph getting 50 mpg (statute miles) only has a cruise index of 2460.
Flying with 1800 rpm resulted in a 9% improvement in the cruise index compared to 2600 rpm, albeit at a speed 20 knots slower.
Maximum Airspeed
The maximum level flight airspeed is for when you are in a hurry and time is your sole priority. This is OK as long as you have plenty of fuel to get to the destination and don’t care about the amount of fuel consumed or the cost. To test the effect on maximum level-flight airspeed, every test point was with WOT and the propeller rpm set at the desired test value. I started each series with the mixture full rich and then reduced fuel flow in approximately 1-gph steps. After each mixture change I let the aircraft stabilize for two minutes. When attempting to identify small changes in level flight performance, I find this method of sweeping the mixture from rich to lean very effective. It is much easier to see a difference between a family of curves rather than a couple of points. The resulting curves have the same shape as the “Representative Effect of Fuel/Air Ratio on Power” graph in the Lycoming engine operator’s manual. For my aircraft, the higher the rpm, the higher the TAS at any given fuel flow. The maximum speed increased from 169 knots TAS at 1800 rpm to 186 knots TAS at 2600 rpm, an increase of 17 knots TAS (+10%).

Higher rpm equals higher TAS at any given fuel flow. Speed increased from 169 knots TAS at 1800 rpm to 186 knots TAS at 2600 rpm, an increase of 17 knots TAS (+10%).
Vibrations
Another objective of this test was to measure cabin vibrations as a function of propeller rpm. To measure vibrations an SBG Systems (www.sbg-systems.com) IG-500 triaxial accelerometer was attached to the right side cabin wall. This is where I normally mount my oxygen cylinder, so I already had mounting hardware here, making installation convenient. Cabin vibration data was sampled at 500 Hz, and each propeller rpm was sampled for 16 seconds. An internal low-pass filter prevented aliasing of the signal. Only the vertical acceleration was analysed. The data was recorded on a tablet computer in flight and then post processed using a fast Fourier transform in Matlab. This allowed me to determine the cabin vibration strength as a function of frequency. The strongest vibrations in each case were at the twice-per-revolution frequency (2P), which is not suprising as the 74RV is a two-blade propeller.
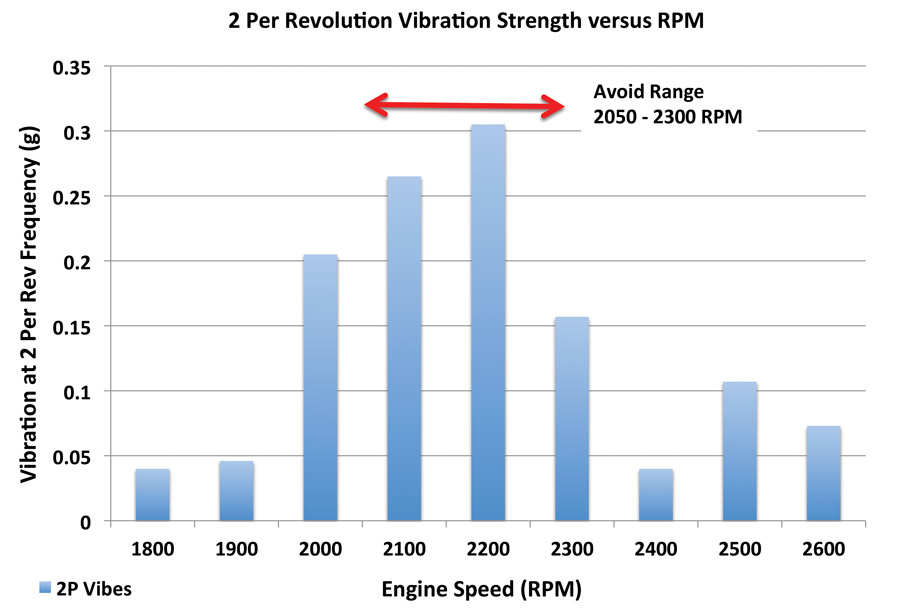
Reducing propeller rpm from 2600 rpm, vibrations increased in the 2050 to 2300 rpm-avoid range. Below this range vibrations decreased again.
The cabin vibration strength at the 2-per-rev frequency was then plotted as a function of propeller rpm. As I reduced propeller rpm from 2600 rpm, I could feel vibrations increase in the 2050- to 2300-rpm avoid range, below which the vibrations reduced again. The measured data supports this perception. A graph showing the intensity of the 2-per-rev vibrations versus rpm is shown above. Clearly, Whirl Wind’s published 2050 to 2300 rpm avoid region is well founded. Based on vibration level, I need to choose either a relatively low or relatively high rpm in my aircraft and pass quickly through the avoid region. If you have used a propeller balancer, you may be accustomed to seeing vibration intensity expressed as a velocity (inches/second or IPS). If you know the frequency of the vibrations, the strength can be expressed as distance (inches), velocity (inches/second), or acceleration (inches/second2 or G) equally well.
Noise
Excessive noise can cause hearing loss, tinnitus, stress, anxiety, high blood pressure, and fatigue, all of which are bad for pilots. I measured the cabin noise level with the dB Meter application on my iPhone, taking an average over 10 seconds. Audio engineers will no doubt be cringing at this crude method. Rather than accurate absolute values, I simply wanted a cheap and cheerful way to see if there was any measureable change in noise with rpm. As propeller speed was reduced from 2700 rpm to 1800 rpm the sound level reduced from 90 dBA to 81 dBA. Despite the variation in noise with rpm, good quality hearing protection is always required in my aircraft regardless of engine speed.

As propeller speed was reduced from 2700 rpm to 1800 rpm, the sound level reduced from 90 dBA to 81 dBA.
Safety
One hazard that results from conducting a test and recording performance data or operating test equipment is a loss of situational awareness caused by spending too much time “eyes inside” while recording data. This can increase the risk of a midair collision or controlled flight into terrain. To mitigate these risks, you could consider doing some or all of the following:
- Choose test airspace that has low traffic density.
- Use ATC flight following services and/or onboard traffic systems to assist with separation.
- Use your EFIS data logger and/or take a passenger to record the data while you concentrate on flying.
- Choose a test altitude that affords plenty of terrain clearance.
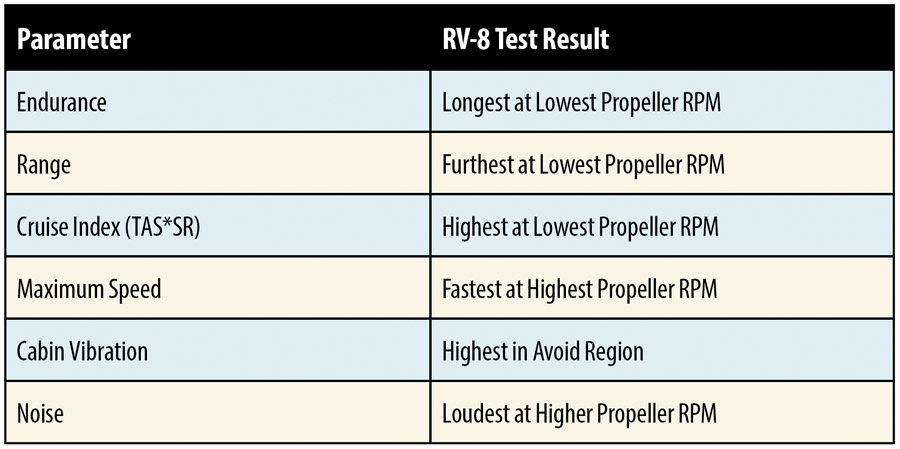
Summary of Test Results
Conclusions
The endurance, range, and cruise index were all optimized by using the lowest possible propeller rpm. On the other hand, the maximum airspeed was achieved at the highest propeller rpm. The noise was lower at lower rpm. The vibrations noticeably increased in the avoid region, making midrange settings unusable. I can’t say whether these variations were due to the propeller, engine, or airframe, and at the end of the day, it really doesn’t matter. I know the overall effect and can make an informed operational decision based on that. With my main use of the aircraft being cross-country weekend trips, it will probably come as no surprise that when traveling long distances, I operate my propeller in the 2400-2500 rpm range. But when I am loafing around the local area, I tend to operate in the 1800-1900 rpm range. This test demonstrated to me that there are substantial performance gains to be made simply by choosing the correct propeller rpm for the task at hand.
![]()
Nigel Speedy started flying helicopters with the Australian Army and is a graduate of the U.S. Naval Test Pilot School. He currently instructs at the National Test Pilot School in Mojave, California. Nigel enjoys flying his Van’s RV-8 and the freedom of E/A-B to experiment.


