In the last flight test article, we explored using the data logging capability of our EFIS to measure the rate of acceleration in level flight, then used a little math to convert that into climb performance. For those of you who don’t have an EFIS, have an aversion to math, or just like flying a lot, this month we will achieve the same goal via a more traditional flight test technique. The “sawtooth” climbs and descents technique works very well but takes a little time. Compared to the “level acceleration” method we looked at last time, the sawtooth offers an easy-to-fly method that also allows us to determine glide performance with simple data reduction and pretty low risk.
Overview
The basic approach is to perform a series of climbs and descents over a measured change in altitude at a range of airspeeds. The resulting vertical flight profile looks like the teeth of a saw, hence the name. You measure the time to climb to a known height and convert this to a rate of climb (ROC). On a nonstandard day you can measure the Outside Air Temperature (OAT) and make appropriate corrections. You repeat this process varying airspeed and then plot the resulting ROC versus airspeed to determine the best angle (VX) and best rate of climb (VY). To get enough data to fully define the climb and descent curves, you need about 10 good data points. This will take about an hour to achieve at a single weight and altitude. If you want to define a climb schedule (determine how VX and VY vary with altitude), you will have to invest several hours in climbing and descending.
Flight Profile
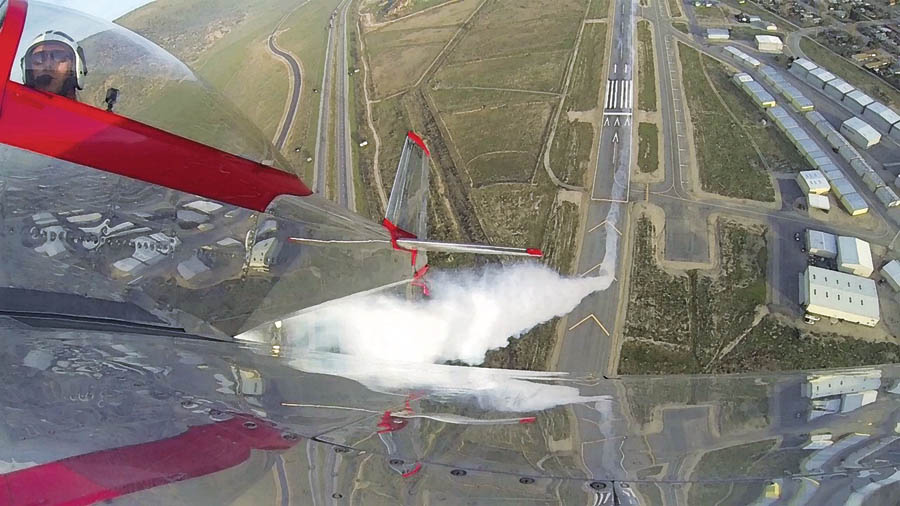
For this flight I took off with 30 gallons of fuel, which put the start weight at 1500 pounds (mid) and cg at 80.0 inches (forward). I flew a series of climbs and descents at 10-knot intervals from 60 KIAS to 152 KIAS between 9500 feet and 10,500 feet. This covered the power-off stall speed to maximum level flight speed for my aircraft at this altitude. Climbs were flown with wide open throttle, propeller at 2500 rpm, and mixture set to 1200 F EGT (100 F ROP). Descents were flown with throttle idle, propeller full coarse, and mixture as set for climb. For comparison purposes two additional descents were flown, one with propeller full fine and another with mixture at idle cut off.
Flight Test Technique
Preparation: The first part of the test is to climb and level off at the middle of your test altitude band. For this test I used 10,000 feet. Set the climb power you will use for all subsequent points, and let the aircraft accelerate to its maximum speed in level flight (VH). This will take about 3 minutes. Record the VH and the OAT. The OAT will be used post flight to make corrections for what is likely a nonstandard atmosphere. This correction is necessary if the temperature is warmer or colder than ISA standard.
Climbs: The setup for a climb starts below the test altitude band. You need to start far enough below the test altitude for the engine and airspeed to be stabilized (500 feet will do the trick with RV-like performance). In this example my test altitude band was 9500 feet to 10,500 feet, so I started my climbs at around 9000 feet. The airplane is established with maximum continuous power set and trimmed for the target airspeed. As you reach the bottom of the test altitude band, start the stopwatch. When you reach the top of the altitude band, stop it and record the elapsed time. From the measured change in height (1000 feet in this example) and elapsed time, you will be able to calculate the rate and angles of climb. Try to maintain the target airspeed as closely as possible making small and smooth elevator changes. A good scan of the aircraft pitch attitude and airspeed is required. Don’t forget to keep the aircraft in balance and the wings level, which can be tough in high-performance aircraft at low speeds with climb power.
To properly identify VX and VY it is necessary to have test points slower and faster than these values. For my RV-8 the power-off stall speed is 60 KIAS, so this was the slowest speed I used in the climb. Note that the power-on stall speed is slower than the power-off stall speed. Even so, I had the stall warning sounding continuously for this climb. To properly identify VY you also need some high-speed climbs. The maximum speed in level flight (VH) where ROC = 0 fpm will provide an end point or anchor to the climb data. Note that while it is convenient to do climbs and subsequent descents at the same speed, there is no requirement to do so. The climb data is separate from the descent data. If you do a climb at 60 knots but your next descent is at 62 knots, this will not affect the result one bit.
Descents: Once your timed climb is over, continue to about 500 feet above the top of the test altitude band. This will set you up for a timed descent. Retard the throttle to idle, pull the propeller to full coarse (if it is a constant speed unit) and trim the aircraft for the target airspeed in descent. Once you reach the top of the altitude band, start your stopwatch. Keep airspeed as close to the target as possible and stop the stopwatch as you reach the bottom of the test altitude band.
Data Analysis
After the flight, take the test data you recorded on your data card and open up a new spreadsheet in Excel (or use a blank piece of paper and a calculator if you prefer). An example of the data reduction steps I used is shown in Table 1. Rate of climb in feet per second (fps) is the altitude change/elapsed time. Multiply this by 60 to convert feet per second to pilot-friendly feet per minute. Ttest is the OAT at the test altitude in degrees Celsius. Convert this to Kelvin by adding 273.15. The Tstd is the standard day temperature at the test altitude. This is 15 – (1.98 * Test Altitude/1000) + 273.15. Ttest/Tstd is the ratio of the temperature at the test altitude divided by the standard day temperature at the test altitude (in absolute temperature units of Kelvin). Tapeline ROC is the Ttest/Tstd * ROC fpm. I did my testing in summer on an ISA+17 day, so the 1000-foot pressure altitude test band was really 1063 feet due to the higher temperature. Convert IAS to TAS using altitude, temperature, and an E6-B or online calculator. Convert TAS in knots to fpm by multiplying by 100.8. If you want the climb angle (gamma) this is γ = ASIN (Tapeline ROC/TAS)*57.296. In Excel the ASIN function returns angles in radians and multiplying by 57.296 converts to degrees.
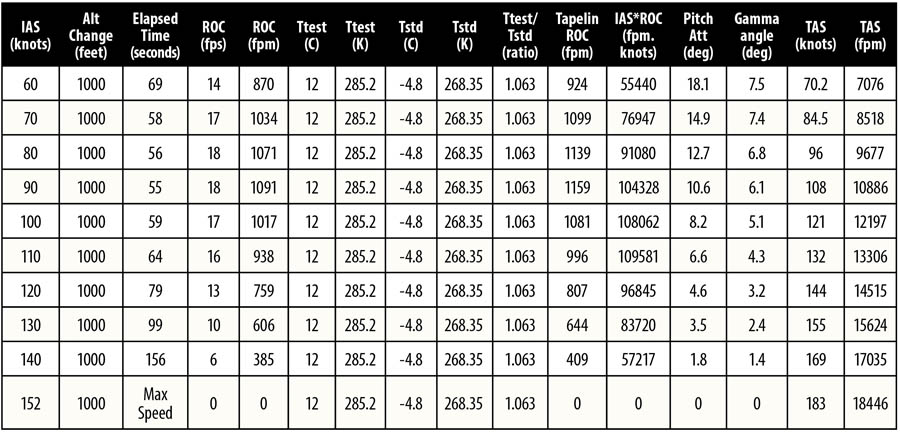
Table 1: Data reduction steps used to determine climb performance.
Best Angle of Climb Speed (VX)
To determine VX start by plotting the ROC versus IAS. You can determine the speed for best angle of climb by drawing a tangent from the origin to the climb rate curve. Don’t let Excel choose the axis scales for you; ensure both scales begin at zero to provide a true origin. Climbing at this speed will yield the greatest height gain per distance traveled. In straight-wing, propeller-driven aircraft, this speed tends to be just above the stall. In my RV-8 the actual VX is 60 KIAS, but this is also the power-off stall speed. In practice I use a VX of 75 KIAS which is 1.25*VS. This slightly higher climb speed results in a slightly shallower climb angle (7 compared to the maximum of 7.5), but it provides a decent margin to the stall. This is shown in the climb angle versus airspeed graph. The most common use for VX is clearing obstacles during a short field takeoff. If you truly have obstacles to clear, VX is the best speed for the job. The disadvantages of climbing at VX are the small margin to stall speed, poor forward field of view with a high nose attitude (which is also uncomfortable for passengers), and poor engine cooling. In the event of an engine failure, the aircraft will also decelerate quickly, making recovery challenging. Use VX if you must, but as soon as you are clear of obstacles accelerate to VY or faster.

Best angle of climb is 7.5 degrees at 60 KIAS.
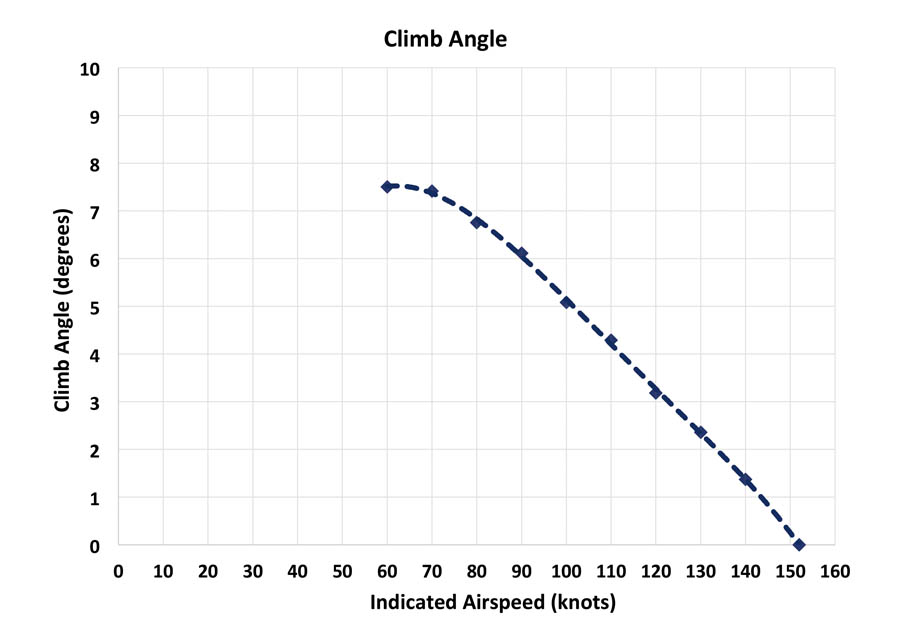
As airspeed increases the climb angle decreases.
Best Rate of Climb Speed (VY)
The airspeed for best rate of climb (VY) is the peak or highest point of the rate of climb versus airspeed curve. Climbing at this speed will yield the greatest height gain per minute. In my RV-8 the VY at 10,000 feet and ISA +17 C test conditions was 90 KIAS. The most common use for VY is gaining height quickly after takeoff. Climbing at VY results in higher stall margin, better field of view and engine cooling, and easier recovery from an engine failure than VX.
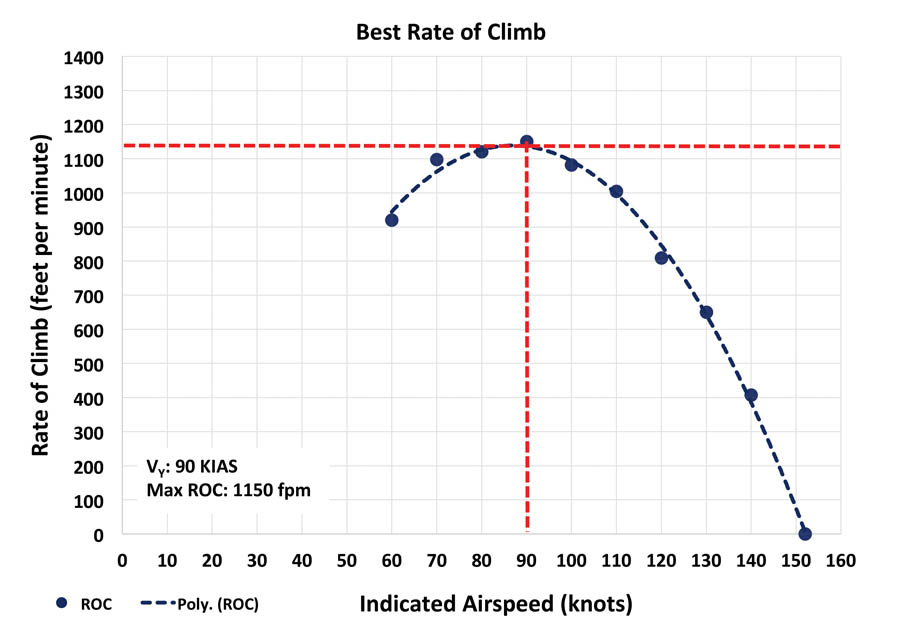
Best rate of climb is 1150 feet per minute at 90 KIAS.
Best Efficiency of Climb or Cruise Climb Speed (VZ)
VX and VY are both maximum effort speeds; that is they maximize a single parameter of performance. When flying cross-country, the climb rate (fpm) and the forward rate (knots) are both important. You want to get to altitude, but you also want to get to the destination. If you multiply airspeed by the rate of climb and then plot this value against airspeed, the resulting curve looks like the climb rate curve, but the peaks are shifted right. If you climb at the airspeed where Airspeed * ROC is maximized, this can be defined as a cruise climb. This idea is a play on the Carson’s Speed for cruise flight (which sought to maximize Airspeed * L/D). The term “VZ” was coined by Norm Howell in his master’s thesis titled “Introducing VZ: Best Efficiency of Climb Speed for Small Airplanes.” VZ is a higher airspeed than VX or VY and results in a lower pitch attitude for better forward field of view, greater passenger comfort, better engine cooling, and easier recovery in the event of an engine failure. VZ in my RV-8 under the test conditions was 105 KIAS. During a normal takeoff, I continuously accelerate from liftoff speed to achieve VZ by 1000 feet AGL.
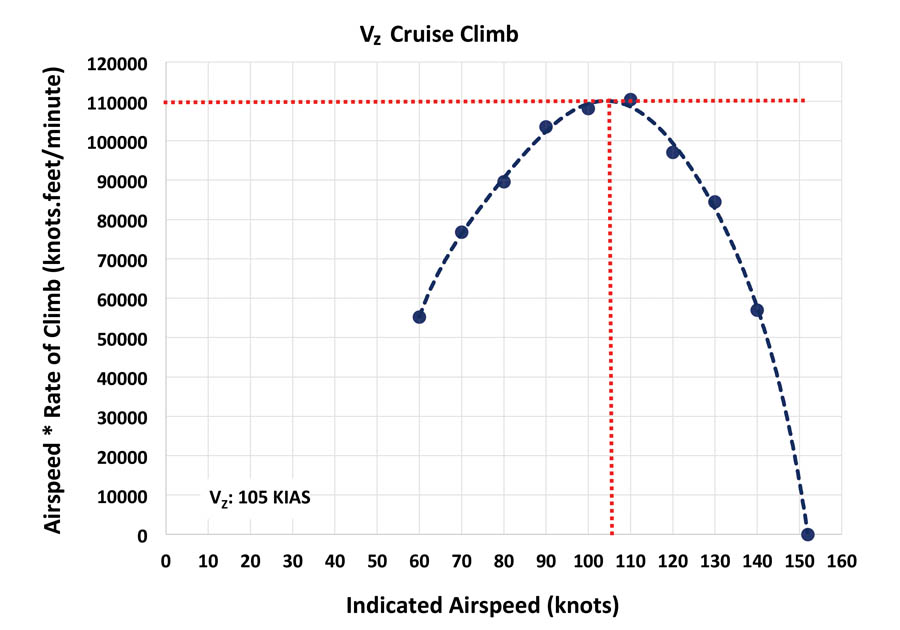
Best efficiency of climb (aka cruise climb) is 105 KIAS.
Minimum Rate of Descent Speed (VminROD)
The airspeed for minimum rate of descent (VminROD) is the peak or highest point of the rate of descent versus airspeed curve. Descending at this speed will result in the maximum time aloft for the height available. In my RV-8 under the test conditions, VminROD was 80 KIAS. In the event of an engine failure, gliding at this speed will give you the greatest amount of time for troubleshooting, attempting a restart, or writing a short note to Mom.
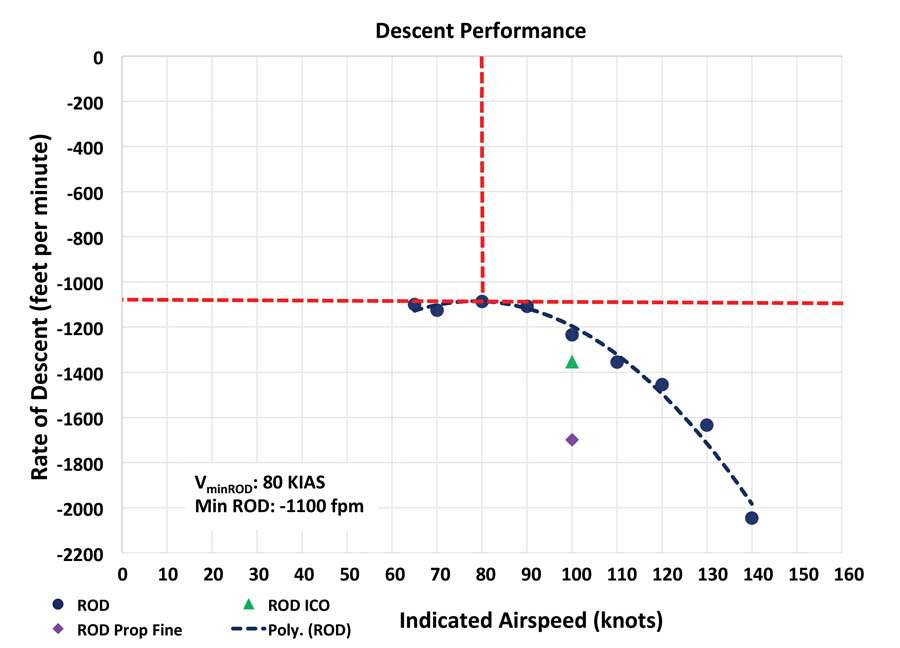
Minimum rate of descent is -1100 feet per minute at 80 KIAS.
The data reduction steps I used to determine the descent performance are shown in Table 2.
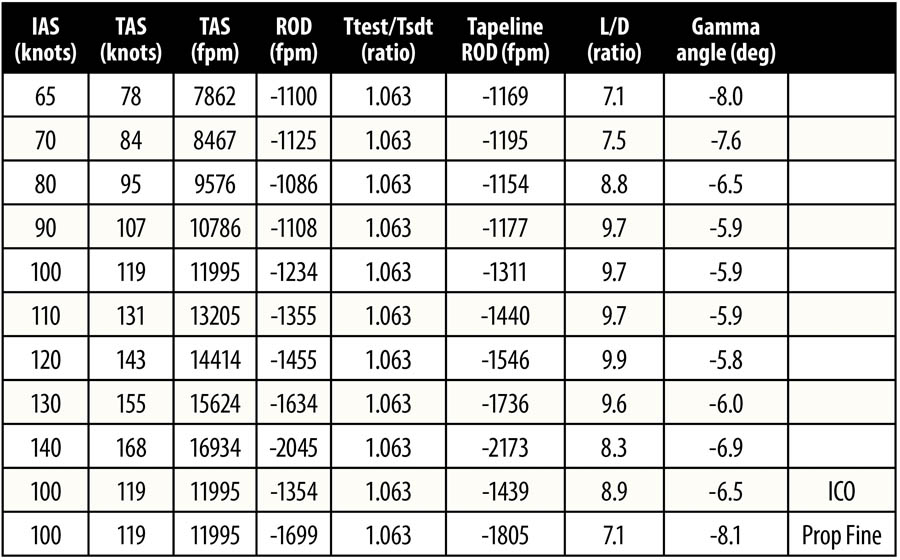
Table 2: Data reduction steps used to determine descent performance.
Maximum Glide Speed (Vmaxglide)
The airspeed for maximum glide (Vmaxglide) is the tangent from the origin to the ROD curve. As we are measuring ratios and angles, the vertical speed and horizontal speed must both be in geometrically equivalent units. Therefore, we need to convert the ROD to tapeline using the OAT, and the IAS to TAS. Using IAS and uncorrected ROD will yield an erroneous glide angle or L/D ratio. This is important if your EFIS or electronic flight bag (EFB) has a “glide ring” feature and you need to set the glide performance. Descending at Vmaxglide will result in the maximum distance over the ground for the height available. In my RV-8 the Vmaxglide is 125 KTAS (105 KIAS). In the event of an engine failure, gliding at this speed will give you the greatest potential to find a suitable forced landing site.
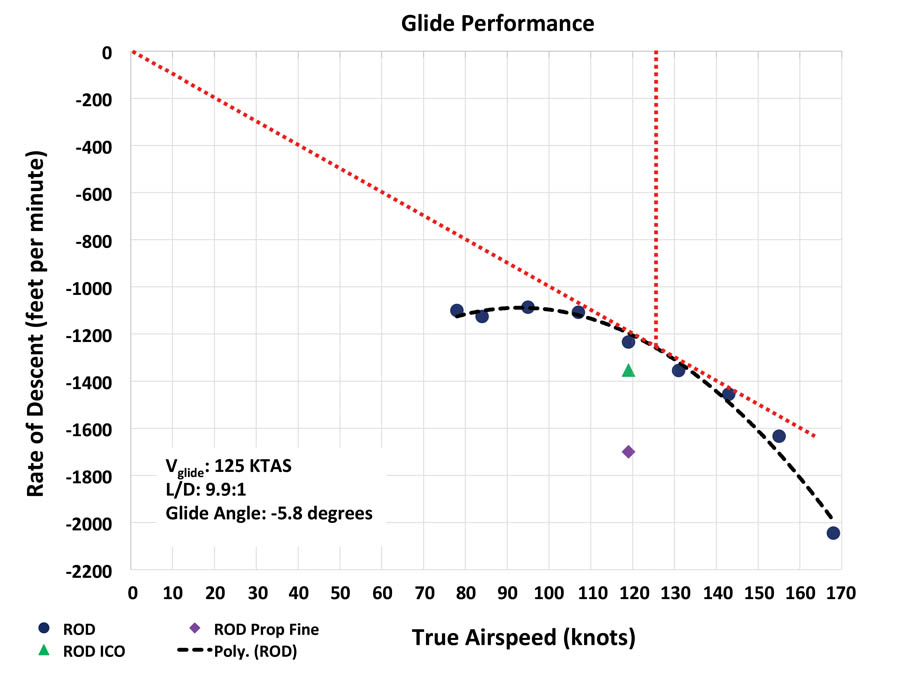
Best angle of glide airspeed is 125 KTAS (105 KIAS).
Climb Schedule
To determine the effect of altitude on VX, VY and VZ, you need to repeat the sawtooth climb and descent test profile at other altitudes. For example, conducting this test at 5, 10, and 15 thousand feet will cover the practical altitude range of the typical RV. If you have the time and inclination, you can increase the number of altitudes tested.
Effect of Mixture at Idle Cutoff (ICO)
A question that comes up occasionally is the effect of doing descent performance with the engine running versus with the mixture at ICO. To test this effect, I did an additional descent at 100 KIAS with the mixture at ICO. From the cockpit there was no perceptible change in noise or glide performance. The only thing I noticed was that the fuel pressure was higher at 36 psi versus the normal 28 psi. Not surprising as the engine was still turning at 1180 rpm, so the fuel pump was trying to pump fuel, but there was nowhere for it to go. From the glide performance graph, it is clear there is a small difference between mixture normal and at cutoff; in my RV-8 it changed the L/D from 9.9:1 to 9.0:1. In the event of an engine failure where the engine continues to rotate, such as fuel starvation, the glide performance will be around 10% worse than simulated glides with the engine idling.
Effect of Propeller Pitch
Another question that comes up is the effect of propeller setting on descent performance. This only applies to folks with a constant-speed propeller and assumes the engine fails but continues to spin. During a glide at 100 KIAS, moving the propeller lever from full coarse to full fine resulted in the engine speed increasing from 1180 to 1810 rpm. The energy to turn the engine and propeller at higher rpm comes from a faster transfer of potential energy to kinetic energy. That is, the aircraft descends faster. At 100 KIAS the ROD increased from -1234 fpm with propeller in full coarse to -1699 fpm with the propeller in full fine, a 38% increase in descent rate. In the event of an engine failure where the engine continues to windmill, there is a significant glide performance advantage to be achieved by pulling the propeller lever full aft to the full coarse position. If you suffer a catastrophic failure and the engine seizes, this is not a factor. I did not attempt to slow the aircraft enough to cause the propeller to cease windmilling. The glide performance graph shows that the L/D reduces from 9.9 with propeller coarse to only 7.1 with propeller fine.
Safety
There are a couple of hazards associated with the sawtooth climb and descent flight test technique. The first is stalling at high power and low altitude. In general aviation aircraft all the important climb speeds are between the stall speed and around twice the stall speed. To identify VX you will need a climb data point that is close to your aircraft power-off stall speed. Climbing at high power tends to make the stall characteristics worse. The effects of the engine torque and spiraling slipstream are greatest, but the ailerons are less effective due to the low speed. You should be proficient in power-on stalls and recoveries before using this test technique at low altitudes. Protracted climbs at very low speeds also lead to high cylinder-head temperatures. Be sure to monitor your gauges or consider setting your engine monitor alarms lower for this test. Transitioning from a maximum-power climb to an idle descent is also a bit harsh on the engine due to the rapid changes in thermal load. Consider periods of moderate power in between climbs and descents to reduce the thermal shock. If you decide to do descents with the mixture at idle cutoff for realism, you must be prepared for the engine not to start running again. You must be proficient in engine-out landings and have a suitable field continuously within glide range if you choose to do this. To reduce exposure to this risk, I suggest doing preliminary tests with the engine running to identify VminROD and VGlide. Once these two speeds are identified you could consider repeating the glide descents with mixture at cutoff at just these two speeds to quantify the small change due to having the mixture at cutoff versus running.
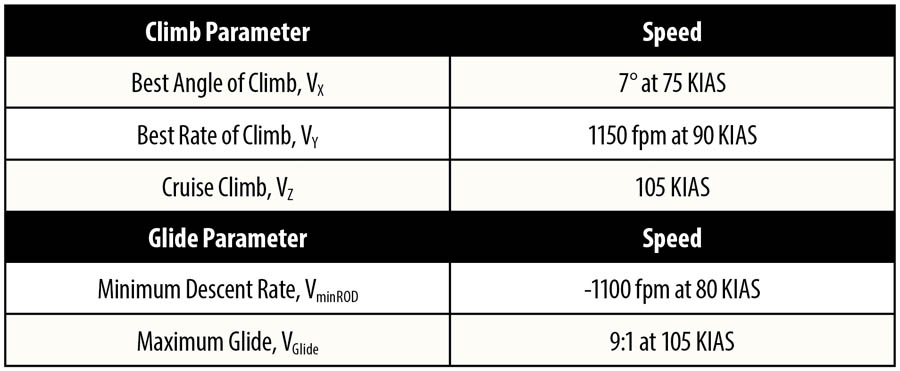
Table 3: Summary of sawtooth climb and descent test results at 10,000 feet.
Conclusion
The sawtooth method works well, but good results require accurate airspeed control and a considerable investment in flight time. The payoff is relatively easy data reduction.


Nigel – another great article! I’m attempting to compute glide ratios using a combination of the methods from this article & EFIS data analysis similar to what you did in the level accelerations article. In that article, you included a table labeled “definition of terms” that provided details of the calculations used. I found that to be extremely helpful. In this instance, I’m having trouble replicating the calculations you show in Table 2. above. In particular, I’m not able to get the same values for L/D ratio & gamma angle. I suspect that I’m using incorrect formulas.
Another question – above you say “Convert TAS in knots to fpm by multiplying by 100.8”. I found a value of 101.269 on several online calculators. Any idea why the difference?
Thanks for any more details you can provide, and thanks for writing these articles.