It should come as no surprise that there are a lot of RVs out there. About one-sixth of all Experimental/Amateur-Built aircraft registered in the U.S. started life as bits of metal from Oregon-based Van’s Aircraft. Almost 30% of new homebuilts in 2009 were RVs, and that’s actually down from several years ago, when it was nearer 40%. By the end of the first quarter 2010, the Van’s “Hobbs meter” had rolled over 6700 aircraft flying—and that’s only the ones the company knows about.
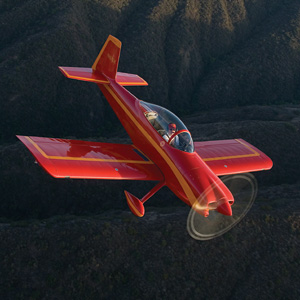
The accident statistics for the RV-8 are skewed by pilot experience. RV-8 pilots tend to have more total hours than pilots of the other RV models.
Sadly, a lot of RVs means a lot of RV accidents. How do the various models stack up against homebuilts as a whole and among each other? Over the years, I’ve assembled my own database of amateur-built aircraft accidents, based on the NTSB summaries, to cover the years 1998 through 2007. During that time period, there were more than 2000 homebuilt accidents, so the data set is reasonably large.
The last time KITPLANES® published my accident review was in the October 2008 issue. At that time, the overall accident rate for Experimental/Amateur-Built aircraft was 0.87% per year by fleet size, which is a different metric than measuring relative to hours flown. The overall general-aviation fleet in that period had a rate of 0.61% per year. But if you remove the homebuilt accidents that occurred during Phase I flight test, the overall rate was 0.71%. Lower, but still 15% above the GA fleet.
That was for the entire homebuilt category, but let’s have a closer look at the data to see how the RVs compare. (For narratives from specific NTSB reports, see below).
Pilot Error
The most-common cause of accidents remains, simply, pilot error. There are two factors in the category I will label Pilot Error: Mistakes involving stick-and-rudder skills and errors involving risk management. The first type of error I call Pilot Miscontrol. A typical example of this would be a ground loop, stalling on initial climb, undershooting the landing, etc. External factors (such as a crosswind) often play a part in these accidents.
Risk Judgment pilot errors are those that involve the pilot’s planning or decision-making ability—continued VFR into IMC, buzzing, fuel exhaustion, etc.
Figure 1 compares the results for the RV fleet to that of the overall homebuilt fleet, and an interesting result it is. The RV Pilot Miscontrol rate is slightly lower than average, but the Risk Judgment errors more than make up for it. Then again, the RV is a fairly high-speed aircraft that is well-suited for cross-country travel. Airplanes that venture out of the local area are more likely to have accidents that stem from get-there-itis—often manifested as fuel exhaustion, pushing weather, the often deadly VFR-into-IMC prang.
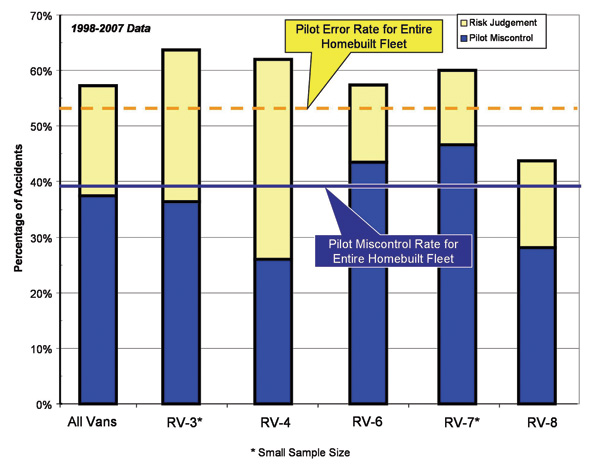
Figure 1: RV Pilot Error Accident Rate.
A Curious Result
One thing I’d hoped to use RV accident data for was to settle the great “taildraggers versus trike” debate. The Van’s product line features near-identical models that differ only in landing-gear configuration—the other variables would be fairly well controlled. This would be my chance, I thought, to settle how much more dangerous the taildragger configuration is.
No such luck. Check out Figure 2. The rate of Pilot Miscontrol accidents for RV-6As (the trigear version) is 11 percentage points higher than for the taildragger! Could this be? Doesn’t everyone know taildraggers are just waiting to snap around on the unsuspecting pilot?
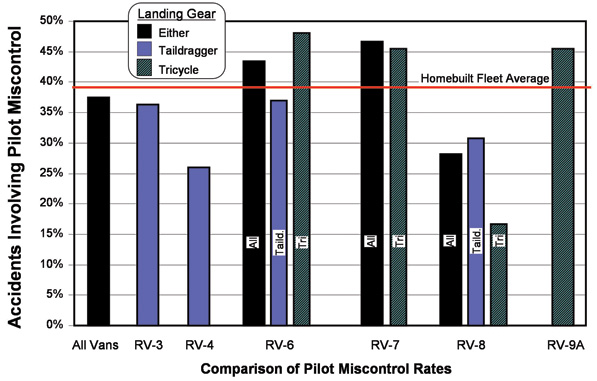
Figure 2: RV Pilot Miscontrol Accident Rate.
Oh, but it’s not that cut and dried. Looking at the phase of flight at the time of the accident provides a clue. Overall, about 22% of homebuilt accidents occur during landing, while 45% of RV-6A cases occurred during landing.
And therein lies a tale. Several years ago, the NTSB noted that the RV-6A seemed to have a higher incidence of accidents that involved collapse of the nosegear leg, followed by the plane flipping on its back. This was never an “out of the blue” event—the occurrences were always part of an accident sequence that involved a bounced landing, soft runways and other factors. But about a third of the RV-6A accidents in my database ended with a flipped aircraft, and the NTSB usually assessed them as pilot error.
As you might expect, this raised a bit of controversy in the RV world. The NTSB report concluded that the gear leg was strong enough, but that the soft surfaces and/or hard landings brought the nosegear fork—in particular, the large nut that secures the fork to the end of the tubular-steel gear leg—into contact with the ground. Van’s came out with a revised design that gave a bit more ground clearance. Many in the RV community, though, still view this as a pilot-error problem, not a design issue. But the take-home should be clear: Treat the A-model nosewheel kindly, fly the airplane properly during final approach and landing, and be wary of rough strips.

As a rule, RV-8 pilots have fewer “Pilot Miscontrol” and “Pilot Judgment” accidents.
The “Sticks” in the Stick-and-Rudder Errors
One of the fascinating results of the “taildragger versus nosegear” analysis was the total number of pilot hours at the time of the accident. RV pilots, overall, had more than 20% more total flight hours at the time of the accident (median 1200 hours against 951 hours for all homebuilt accidents). But looking at RV-6 accidents, pilots of the taildragger version had more than twice as many hours as the pilots of the nosegear version: median 1700 hours versus 784 hours!
This total-time discrepancy undoubtedly factors into the Pilot Miscontrol rate for the two types. However, it does tend to imply that the taildragger versions are being built or purchased by more experienced pilots, and that less experienced pilots are opting for the nosegear versions to stay away from those “dangerous taildraggers.” However, the median time-in-type for both planes is about the same: 95 hours for the nosegear versions and 89 for the taildragger.
Other Accident Causes
Let’s look beyond Pilot Miscontrol. Figure 3 shows the relative rate of occurrence of accidents that do not involve that cause factor. In this respect, the RV series is pretty close to the overall homebuilt rates, but comes out quite well in the Maintenance Error category.
Of note, however, is the way that engine problems seem to stand out in the RV-8 series. The relatively small number of RV-8 accidents in my database (32 from 1998 to 2007) might be a factor. Also interesting is the relative infrequency of “non-traditional” engines in the RV accidents. Overall, only about 51% of homebuilts involved in accidents have traditional engines such as Lycomings and Continentals, but about 87% of the RVs in the accident lists do.
It’s difficult, though, to determine the overall installed base of engine types in the homebuilt fleet. In cases where the builder declared an engine type in the FAA registration database, more than 95% declared that their airplanes had Lycoming engines, while another 3.5% said their planes had some of the “aftermarket” versions of these traditional engines (Superior, Aerosport, etc.). Only 1.5% of the owners who listed an engine type identified them as auto-engine conversions.
However, these are percentages of those who identify an engine type in their FAA registrations. About 30% of registrations don’t specify an engine type at all, so they could be either. One final note on engines: 36% of RV-9A accidents in my database had auto-engine conversions.
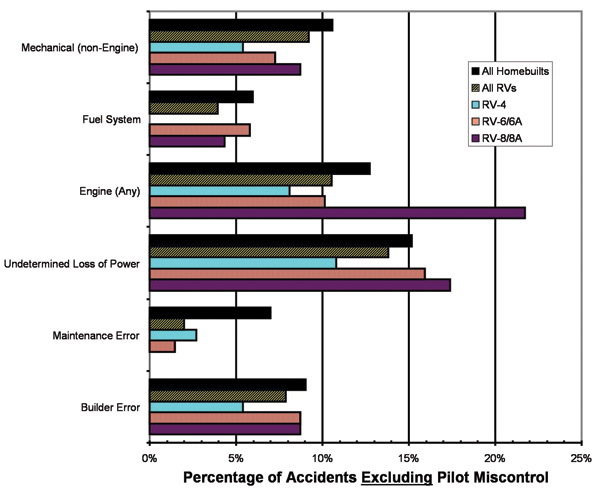
Figure 3: Other Accident Causes.
Fatal Accidents
The overall fatal accident ratio (number of fatal accidents divided by the total number of accidents) for U.S. homebuilts is about 25%. The overall RV fatal accident ratio is about the same, and the various models cluster closely around.
What kills RV pilots? Two causes account for almost 30% of all fatalities: continued VFR into IFR and maneuvering at low altitude (buzzing, abrupt pull-ups after low approaches, etc.). It’s probably pedantic to mention this, but both of these leading accident causes are completely within every pilot’s control.
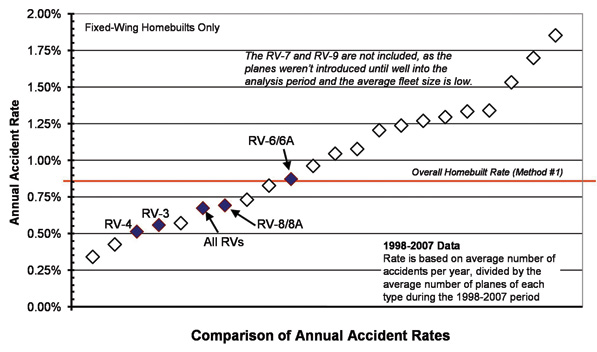
Figure 4: Overall Accident Rate Comparison.
Overall Accident Rate
Over my analysis period, the homebuilt fleet saw an annual accident rate of about 0.85% per year—this is slightly lower than the last analysis with one more year of data, 2007, added to the equations. This rate is computed based on the number of accidents over 10 years, divided by the average homebuilt fleet size during the 10-year period, divided by 10.
As Figure 4 shows, the RV-6 series scores just a tad above that, with the RV-3, -4 and -8 coming comfortably below. The RV series as a whole comes out at about a 20% lower accident rate than homebuilts overall.
This is even better than it originally appears, as the other planes at the low end of the scale are older designs. Older designs tend to have more inactive aircraft (in storage, scrapped, etc.), which tends to artificially improve their accident statistics—if the plane doesn’t fly, it can’t crash! The RV aircraft, being fairly recent designs, are less likely to be sitting abandoned in the corner of a hangar. Their exposure is higher, yet their builders and pilots are still having fewer accidents than the average.
Curious as to what the other airplanes are? Stay tuned to KITPLANES® over the coming months, because we are going to gradually fill in the names. Next month, we will take a look at the Lancair statistics.
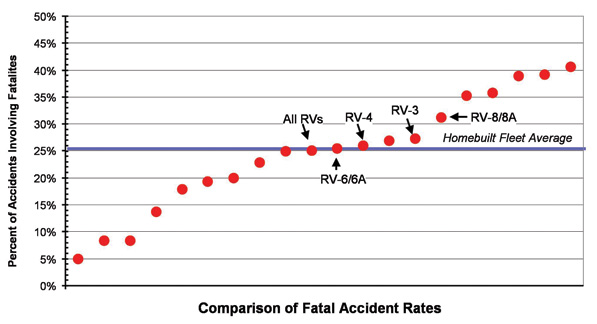
Figure 5: Fatal Accident Rate Comparison.
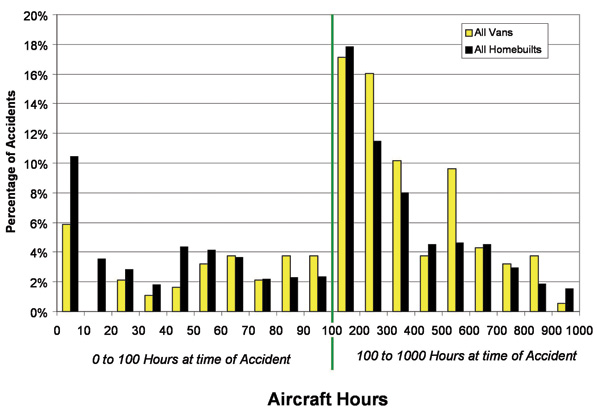
Figure 6: Aircraft Hours.

![]()
Ron Wanttaja is a systems engineer, engaged in satellite orbit/constellation design and analysis, launch vehicle and onboard propulsion system trades, and operations concepts for space systems. He worked on the early design studies for the International Space Station.

