When you build an RV, the instructions include the location and specify the material (simple POP rivets) for your static ports. From what I have heard, in most cases the static system works perfectly right away. That is to say, the altitude and airspeed are correct within some acceptable bounds. That’s a fortunate situation, one that many builders of other craft, especially one-of-a-kind designs, don’t find themselves in. Furthermore, I suspect that many homebuilts fly without the owners really knowing how accurate their airspeed and altitude are.
Altitude indication depends only on the static system. Airspeed indication, and thus accuracy, on the other hand, depends on both the pitot and static systems, since indicated airspeed is derived from the difference between the pitot ram and static port pressures. Airspeed and altitude accuracy correction and calibration both begin with basic system checks, such as airspeed indicator and altimeter error checks, and ensuring that there are no leaks in either system. Several articles detailing manometer methods for performing these checks may be found online, including a spreadsheet by KITPLANES contributor Kevin Horton.
As measurement and indication systems migrate to electronic ADAHRS sensors, indication errors are diminishing. Also, the pitot-delivered ram pressures are generally accurate and relatively independent of pitot alignment, though the pitot must still be located well out of the propwash and spaced below the wing sufficiently to avoid any disturbance by airflow over the wing—which are both relatively easy to achieve. Therefore, airspeed errors are likely dominated by static pressure errors, just like altitude errors. Optimal static port location is clearly important, but in practice is not easy. Our goal here is to hopefully simplify the process.1
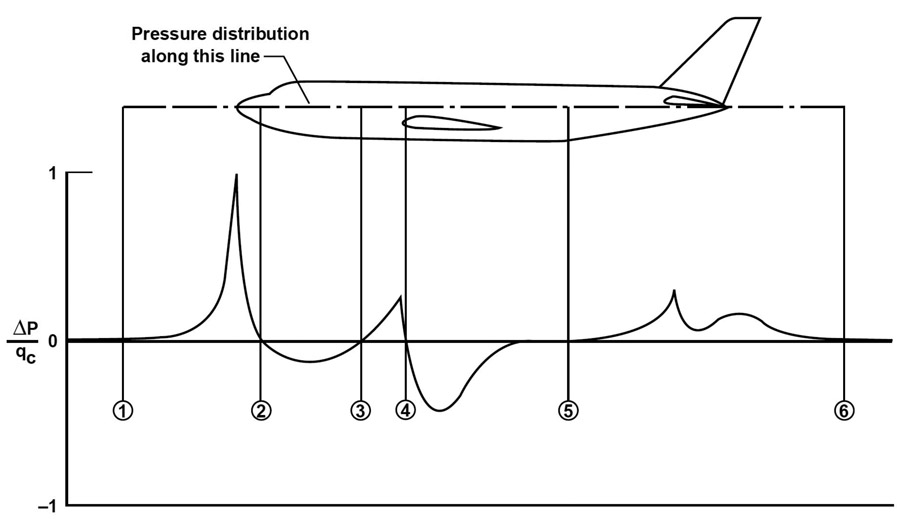
Figure 1: Surface pressure typical lateral distribution. The numbers in the circles (1-6) indicate places where neutral pressure exists, i.e., surface pressure is the same as static pressure at that altitude.
The key to an accurate static system is the location of the port(s) in a place that ideally provides a stable rendition of the (static) air pressure at that altitude. Pressure on the outside of the fuselage varies substantially with position, and often unexpectedly. An ideal location should therefore be in a neutral pressure area, relatively invariant with airspeed, angle of attack, and altitude. Practical static ports may be included in the pitot mast itself, placing them presumably in neutral air. More typically, they are a pair of ports on either side of the fuselage somewhere between the trailing edge of the wing and tail. A typical variation of pressure along the side of a fuselage is shown in the figures. There’s a transition from high pressure (above ambient pressure) to low pressure from wing to tail, and the neutral pressure area is most desirable for port placement. In reality, the neutral pressure zone is a line, as we will explore later, and port placement on that line will be the goal to achieve the best compromise for all important flight regimes.
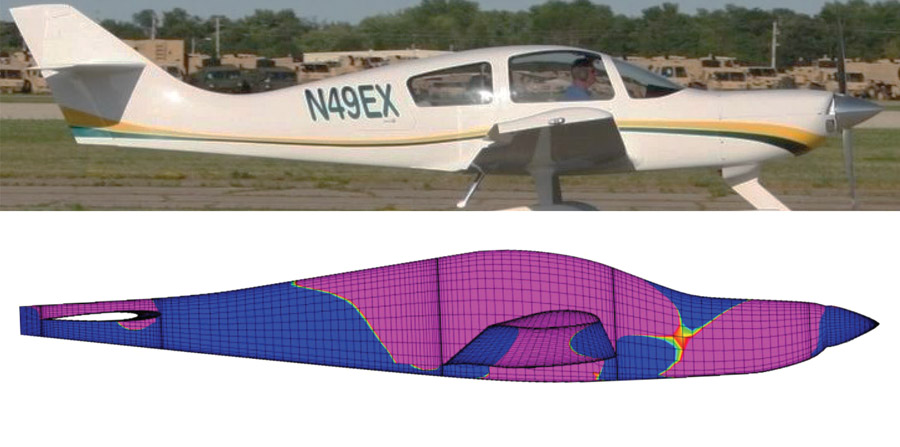
Figure 2: Yellow and green areas depict zero pressure. Magenta is low pressure, and blue is high pressure.
Regulations
While you would like to know your altitude and airspeed as accurately as possible, altitude is clearly the more important for separation safety reasons. The FAA requirements are scattered in a few places and a bit challenging to resolve as to the static port accuracy by itself, but here are the pieces:
14 CFR Part 23—”Airworthiness Standards: Normal, Utility, Acrobatic, and Commuter Category Airplanes,” 23.1325 Static Pressure System, states: “(e) Each static pressure system must be calibrated in flight to determine the system error. The system error, in indicated pressure altitude, at sea level, with a standard atmosphere, excluding instrument calibration error, (my emphasis) may not exceed 30 feet per 100 knot speed for the appropriate configuration in the speed range between 1.3 VSO with flaps extended, and 1.8 VS1 with flaps retracted. However, the error need not be less than 30 feet.”
Furthermore, per 14 CFR Part 43, Appendix E to Part 43—”Altimeter System Test and Inspection,” the altimeter error limits shall be according to the provided table, ranging from 20 to 130 feet, corresponding to 0 to 20,000 feet of elevation.
Finally, the altimeter/transponder correspondence test requires the transmitted altitude to be within +/- 125 feet of the altimeter indicated altitude. For an ADAHRS-based system this error will be near zero. So, to some extent, it is up to the aircraft “manufacturer”—us—to decide how to add all these up and what tolerance to attribute to the port location. Having an ADAHRS-based system and a correspondence test error for the Garmin G3X Touch system near zero, I set a goal of being within +/- 50 feet at 3000 feet, and +/- 125 feet for the range of altitude from 0 to 10,000 feet and the airspeed range of 1.2 VSO to cruise.
It may be a bit surprising that the biennial altimeter/transponder correspondence test does not verify overall altitude reporting accuracy. The test applies pressures to the static port(s) corresponding to the standardized model of atmospheric pressure vs. altitude, and verifies that the system—altimeter and transponder—indicate and report altitude accurately with respect to the applied standard pressures only, independent of whether or not the static ports are accurate in flight. The static ports must be located optimally and supply neutral pressure (within tolerances).
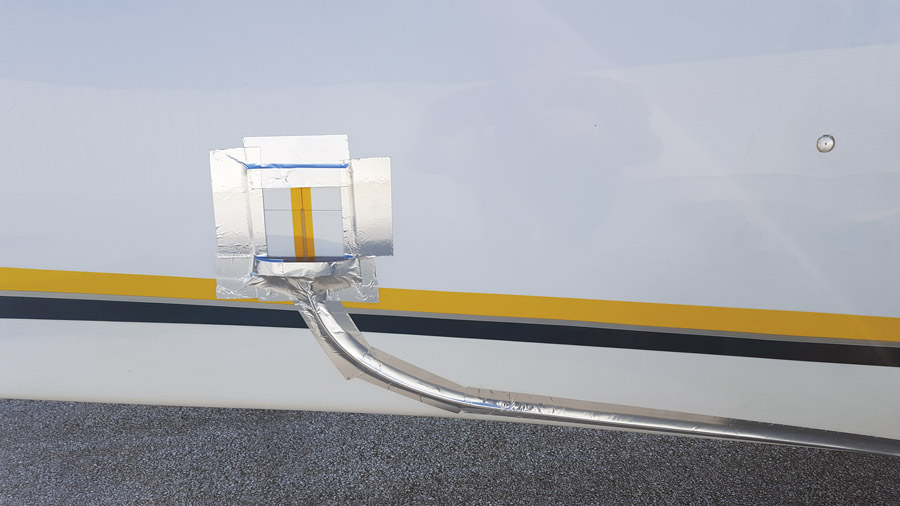
Figure 3: Tests were conducted with the movable static port plates in several different locations on the aft fuselage.
How My Trouble Started
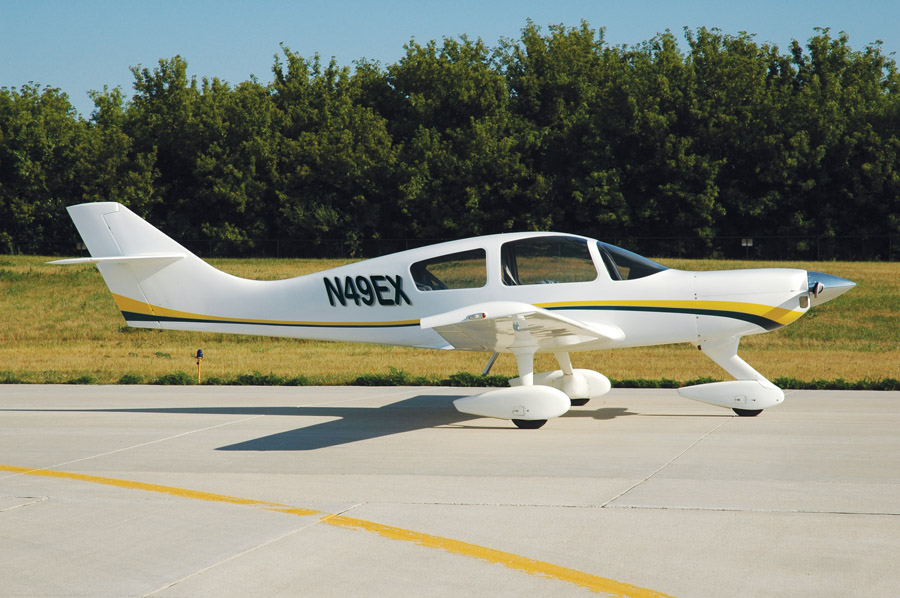
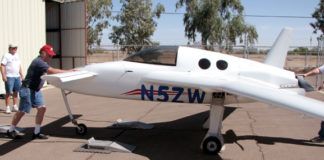
Our Wheeler Express N49EX was originally built with a combined pitot/static probe, which when calibrated was sufficiently accurate for both altitude and airspeed. All was fine until my recent glass panel upgrade, including a Garmin autopilot, which uses the static pressure data for altitude capture and hold. It turns out that the pressure supplied by the static port on the pitot is slightly sensitive to angle of attack, which while not noticeable in the altitude display, makes the autopilot hunt some +/- 30 feet, a nauseating experience! So, a more stable static port location was needed. A quick trial with cabin static pressure stabilized the autopilot, but was substantially off in altitude, as is typical due to lower pressure in the cabin, not to mention variations from the air vents. After several failed attempts to improve the pitot probe static performance, I decided to move the ports to the fuselage.
GPS Altitude Error Calculations
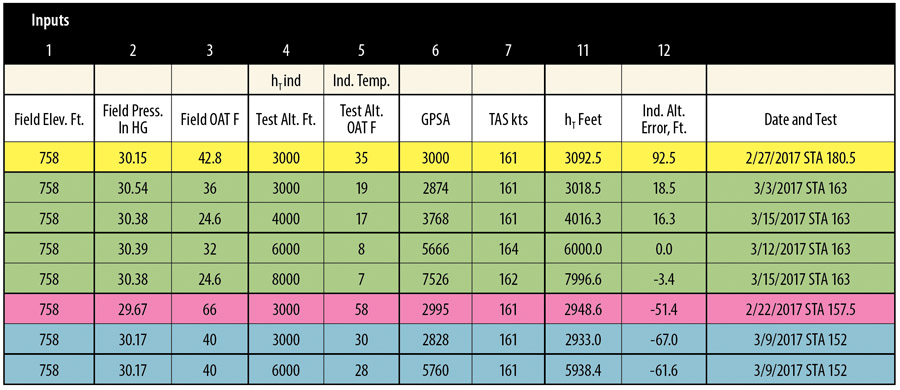
Figure 4: Test flight ground and altitude temperatures and altimeter setting were used with atmospheric pressure and altitude equations to adjust the GPS (true altitude) to what the altimeter should indicate for the test flight atmospheric conditions. This made it possible to calculate indicated altitude error.
First Fuselage Static Ports
I hate to admit the naivet with which I first installed static ports on the fuselage: I simply looked at a number of factory-built planes, such as the Cirrus and Bonanza, and measured the relative distance from tail and trailing edge of the wing, and chose a similar location on my plane. Completing the installation, which of course included making holes in the fiberglass, I was dismayed that, although the autopilot was now stable, the altitude and airspeed were substantially off (by about 130 feet and 10 mph respectively, cruising at 3000 feet). That’s when it became clear that the location of the static ports requires more than guesswork, or even good intuition. After extensive investigation and discussions with several experts, I learned that finding the best location was not easy and, even with commercially produced airplanes, involves a significant amount of trial and error—hundreds of hours as Paul Dye has put it. The prospect of turning my plane into Swiss cheese did not sit well; there had to be a better way!
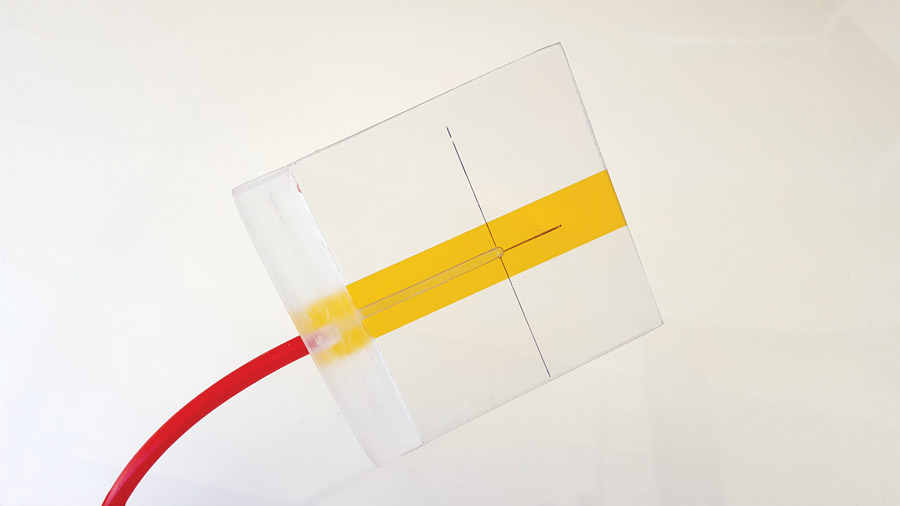
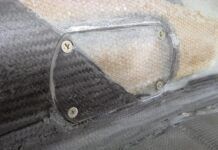
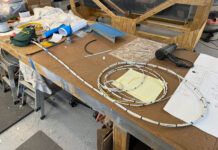
The relocatable static port plate is made from 1/16-inch thick polycarbonate and is attached to the fuselage with aluminum foil tape.
When the movable plate is in the same location as the existing static ports, the altitude and airspeed errors are the same as the ports by themselves.
The process, in any case, assumes and requires a starting point set of static ports, which as described below, may be done with something better than guesswork hole drilling. Then, the next challenge is to determine the error in altitude for any particular port location and how to improve it.
Determining Altitude Error
With an initial pair of static ports (which may be the “moveable trial static ports” described later) and then further trial locations, the first thing is to determine the altitude error (which correlates with port position error). One approach is by inference from airspeed error, since airspeed may be relatively accurately determined with GPS, as described by Kevin Horton in “Flight Testing: Static System Error, Theory and Practice,” which appeared in KITPLANES in October and November 2009. Kevin also provides a spreadsheet at to analyze flight data.
Another way to determine altitude error is to derive it from WAAS GPS altitude. The WAAS specification requires a position accuracy of 25 feet or better, for both lateral and vertical measurements, at least 95% of the time. Actual performance has been shown to be better than 5 feet vertical. That makes it an acceptable source of true altitude for static port evaluation, assuming one has a WAAS-enabled GPS.
That said, it is well known that the indicated altitude will generally not be the same as the GPS altitude unless you have standard atmospheric conditions: temperature, pressure, and lapse rate. Indicated altitude is the universal reference used by all, whether or not it happens to be the same as true altitude—for separation it matters most that everyone is using the same relative altitudes. However, test flight ground and altitude temperatures and altimeter setting can be used with the atmospheric pressure and altitude equations to adjust the GPS (true altitude) to what the altimeter should indicate for the test flight atmospheric conditions, which then allows one to calculate the indicated altitude error. Caveats are that the method will not work with a temperature inversion, and your OAT measurement capability must be accurate. A spreadsheet for the approach is included on the KITPLANES website and is shown in Figure 4.
Now, the problem remains: How to correct the port position error? The assumption by some is that may be achieved by placing dams ahead of or behind existing ports, but I have found that often does not work adequately, especially if the port is too far from the actual neutral pressure zone. It also does not make for a very aesthetically neat solution.
Movable Trial Static Ports
What if one had a moveable static port—one that could be placed in multiple locations, gathering data to converge on the best location? There are two challenges in creating such a tool: First, it needs to be thin and flexible enough to conform to the fuselage at the area of attachment and not materially affect the local airflow as regards the pressure at its port. Second, a tube must be able to be routed from it into the plane and connected to the rest of the static system. This was accomplished with an approximately 4×4-inch, 1/16-inch thick polycarbonate plate with a 0.035-inch hole for the static port. The hole was in turn routed near to the edge of the plate with a 1/8-inch-wide milled channel on the back side, with a depth about half the plate thickness. At the edge of the plate, a 1/2-inch-wide piece of contoured Plexiglass is glued to provide a place for a 1/4-inch access hole that in turn connects to the channel with a small perpendicular hole. The channel is covered and sealed with a piece of Kapton tape. The plate assembly is attached to the fuselage with aluminum foil tape, with the Plexiglass piece parallel to the airflow. Connection from the port plate to the static system is accomplished with a length of 1/4-inch nylon pitot/static tubing, contoured along the side of the fuselage, held in place with a cover of foil tape, and entering the cabin through an available location. The latter, in my case, was at the gear leg, following the route of the brake lines.
Now, one obvious concern might be, can this arrangement fly without fear of it coming off at cruise speed? Well, the answer to that came to me while walking under the Airbus A330 at Oshkosh a few years ago where I saw a bunch of aluminum foil tape on the wings. Talking to the Airbus folks, I was told, “Oh yeah, we do that all the time in development, no problem.” If it works for them, it will certainly work at 160 knots!
Altitude and Airspeed Errors
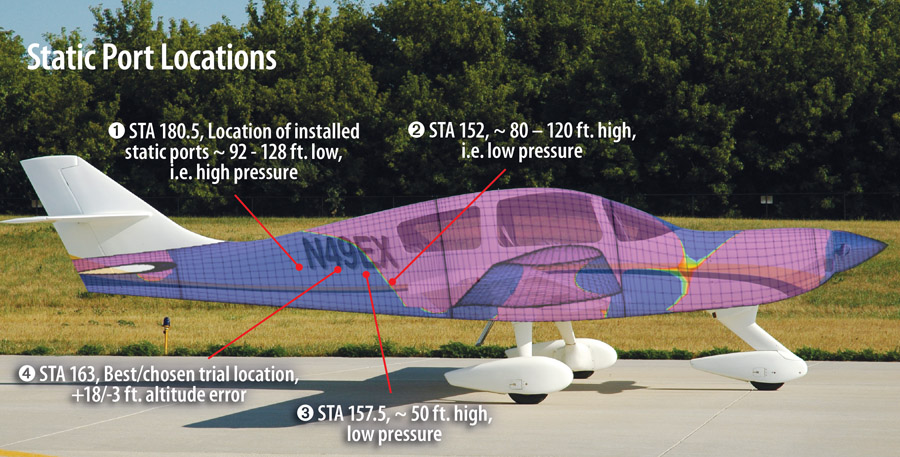
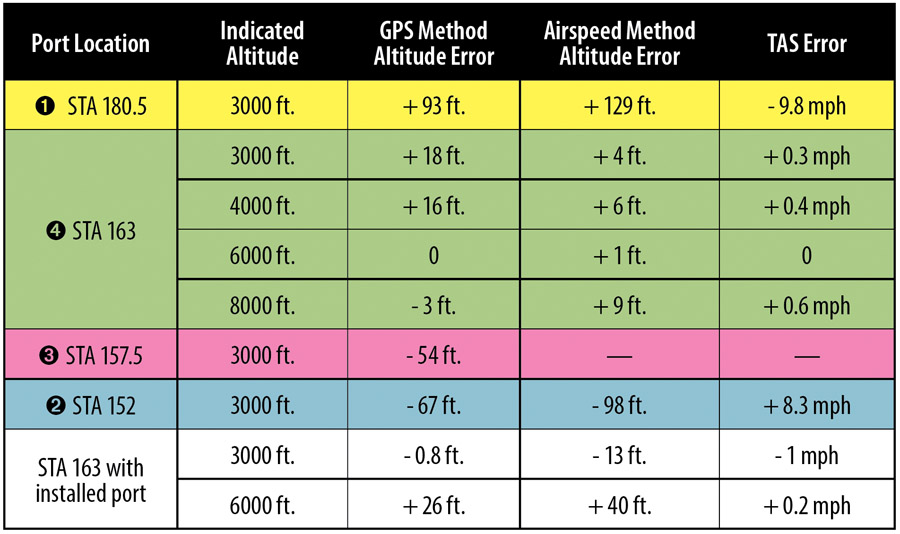
Figure 5: Through trial and error, STA 163 was determined to be the best location for the static ports. The bottom rows show the data for STA 163 with the actual ports installed there.
Pressure Profile Modeling
Relocatable static ports in hand, the first test was to place them directly over the existing installed ports and verify that they delivered the same incorrect altitudes and airspeeds, which they did. This looks like it might work!
Just before proceeding with more guesswork placements of the newly crafted moveable static ports, I lucked into a bit of marvelous scientific method and rigorous engineering that anchored the process in some real data. In an email discussion of my problem and mission with Peter Garrison, who writes the “Technicalities” column for Flying magazine, Peter mentioned to me that he had the CAD model for the Express aircraft and would gladly run a surface pressure analysis for me. That predicted where the areas of zero error should be, providing a starting point for locating the ports. You can see in the pictures the line where this is expected to be, back of the wing. Superimposing the model on a picture of the plane provided guidance for new trial port locations.
Trial Results
Starting with the predicted neutral pressure zone, the first test flight data made my day! Whereas the original ports were in a slightly high pressure area, resulting in airspeed 9 knots low and altitude indication 129 feet low, the new location was now in a slightly low pressure area. The model was not perfect, but I knew the best location was somewhere in between, and in fact can be approximately predicted by interpolation of data points.
Of course, it’s never quite that simple. The pressure gradient is not linear, and in addition a vertical position needs to be found that minimizes the effects of angle of attack, altitude, and airspeed, while avoiding any significant errors in landing configuration with flaps down.
Data/Analysis
After three new trial locations using the moveable port plates, I found what looked like an acceptable final location. Figure 5 shows the altitude and airspeed errors at 3000 feet cruise for the four port positions as shown in the pictures, and at 3000, 4000, 6000, and 8000 feet for STA 163. From the data, it looks like a slightly better position might have been about 1 or 2 inches forward, but that would have put the right port in the baggage door, so I decided that within a few feet and less than 1 mph error was good enough. The bottom rows show the data for STA 163 with the actual ports installed there.
Additional tests at lower and higher altitudes, lower speeds, and in landing configuration all confirmed errors within the original goals. One insight is that the pressure gradient is not linear. With multiple points, a curve fit could be created, but you may find an acceptable location with a few iterations. Note that whereas the plates delivered nearly identical data when installed over my original ports, when the STA 163 ports were installed, there was some difference, though probably acceptable. One refinement may be to make the plates with ports that are more like the contour of the port to be installed.
Summarized Procedure
To recap, here’s the process in review:
1. Verify that your pitot/static system does not have any leaks.
2. Determine any calibration errors in the altitude and airspeed indicators.
3. Establish a set of test conditions, including various combinations of airspeed/power settings, altitudes, and flaps extended/retracted for the slow speeds.
4. If a surface pressure model is available for your plane, use it to determine the initial placement of the static trial plate. If not, pick a location roughly 1/3 of the distance from the trailing edge of the wing root to the tail. For vertical position, locate roughly at the vertical tangent point.
5. Preferably on smooth days, fly your test combinations holding at each of the altitudes (easiest if you have an autopilot), and record indicated altitude, GPS altitude, indicated airspeed, true airspeed, OAT on the ground and at altitude (and some intermediate altitudes to verify there is no inversion).
6. Determine the altitude errors for the various tests using either the inference from airspeed error or adjusted GPS altitude method. If you use the airspeed inference method, your test flights need to include a three course pattern, as described in Kevin Horton’s spreadsheet.
7. If the altitude error is such that the actual altitude is higher than indicated, then the static port pressure is lower than standard for that altitude and likely the port is too far forward, and vice versa. Relocate the trial port in the direction appropriate for a correction.
8. Use the data from the second port to determine a rate of correction per inch of port relocation to predict a better location. The pressure gradient may not be linear, but within just a few locations, the altitude and airspeed errors will likely be reduced into the range of +/- 30 feet and +/- 1 mph.
9. Determine the trial location that provides the best compromise overall results.
Once you’ve found your best locations, it’s time to take the plunge and put holes in the fuselage. One last thought: You may wish to start with just the first port on one side and make sure nothing has changed before proceeding with the second port on the other side.
1NASA Technical Memorandum 104316, Airdata Measurement and Calibration, Edward A. Haering, Jr., 1995
2NASA Reference Publication 1046, Measurement of Aircraft Speed and Altitude, 1980
3Final Report, FAA Contract No. FA64WA-5025, Project No. 320-205-02N, Flight Calibration of Aircraft Static Pressure Systems, 1966






Very informative article. For anyone who may find themselves needing to conduct similar testing, where can the tools needed(polycarbonate relocatable static ports, etc) be purchased?
Thanks! The polycarbonate plate was not purchased. I made it and when I wrote the article I assumed the description and pictures were enough for others to duplicate it. Probably should have included some detailed drawings. In any case it’s not something you can buy – it was custom made for the process.
Thank you Reinhard for the response. I should have checked back here sooner than 41 days. I myself am trying to do this same testing on a Harmon Rocket II. I would welcome any details you care to offer on the polycarbonate plate. I believe I have everything else. Just trying not to cut any more holes in my fuselage where they don’t need to be. That has already happened actually. Your article gave me hope that I could find the correct spot to locate the static ports.
Great article. I have always wondered why altitude indication could ever be accurate from essentially a hole in the skin of the aircraft, since the airflow across the hole would tend to lower the pressure normal to the surface of the skin, and the faster the airspeed, the more the effect.
The static port being at the skin level is at the innermost of the boundary layer, which therefor does not see the flight speed of the passing air, but rather approaches zero at the surface. Although the actual pressure at any given point varies due to the flow distribution, which in turn includes the influences of fuselage contours, prop wash, etc. Therefore it requires considerable effort, trial and error, modeling if it is available, to find an optimal placement where the port essentially picks up the exact static outside pressure. And that was what the article was intended to address.