Part 1 of this series last month explained the background of the speed course method of determining static system position error. That article also described the ground and flight tests required to use this method, and provided a sample test card. This month well walk through data analysis, using actual data from the flight-test program of my RV-8. Data from the 180-knot indicated airspeed (IAS) test point will be analyzed as an example. Two spreadsheets, available for downloading, will be used for the data analysis.
ASI Calibration
The first step is to determine the airspeed indicator (ASI) instrument error by using a water manometer as described in Maintain thy airspeed, lest the ground rise up and smite thee by Jim Weir, February 2009. Note: the data tables in that article are in error. See How to calibrate your ASI by Jim Weir, July 1989, for correct tables of ASI reading versus water manometer height.) Or use the asi_cal.xls spreadsheet. Alternatively, an avionics shop could use a pitot-static tester to calibrate the ASI.
Record the ASI instrument errors working in increasing speeds over the full range that the ASI displays, and again with decreasing speeds. Use the average of the errors with speed increasing and decreasing as the ASI instrument error. The Dynon D-10A EFIS on my RV-8 had ASI errors as shown in Figure 1.
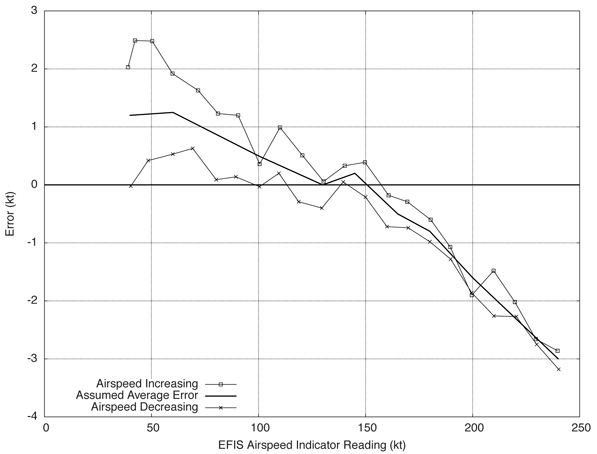
Figure 1.
Flight Testing
The flight testing must be done in smooth air, with no updrafts or downdrafts. The test technique assumes a constant wind direction and speed, so avoid testing during weather conditions that may give wind shifts such as near cold or warm fronts.
Fly four legs, each at a constant heading, altitude and airspeed. The leg directions should be about 90 apart. All legs must be at exactly the same airspeed, but the altitude may be varied 50 feet of the target, if required, to obtain exactly the target airspeed. For each leg, record: indicated airspeed, pressure altitude (with altimeter set to 29.92 in HG or 1013.25 mb), GPS ground speed, GPS track and indicated outside air temperature (IOAT). Allow time for the GPS speed and track indications to stabilize before recording data.
The more accurately the test points are flown, the more accurate the result. It is useful to have someone to record the data and watch for other traffic. An autopilot may be used if available.
The position error may be affected by flap and landing gear position and gross weight. The position error is certainly affected by airspeed, so data should be gathered over the full airspeed range. This technique will work only for speeds that can be attained in level flight, but the airspeed error versus airspeed trend can be extrapolated to VNE. The raw data recorded from my RV-8 at 180 knots IAS is seen in Table 1. This data will be analyzed as an example.
OAT Probe Accuracy
The determination of an accurate calibrated airspeed (CAS) starting from a TAS requires accurate knowledge of the OAT. The accuracy of your OAT indication should be confirmed, and any errors noted so they can be used to correct the recorded values. The OAT probe may be inserted in a mixture of water and ice, which should produce an indication of 32 F (0 C). The OAT indication may also be compared against Automatic Terminal Information Service (ATIS) values, but be aware that the sun may cause the air near the ground to be warmer than the reported values. It would probably be more accurate to view the OAT in flight just before landing, and compare that against the ATIS.
The OAT probes location may affect its accuracy. It should not be in the wake of the engine exhaust or cowling air exits. Many builders of RVs have put the OAT probe in the fresh-air scoop on the side of the forward fuselage only to find that the warm cockpit air heated the cockpit end of the OAT probe, causing it to over read. The sun shining on a probe on the top or side of the aircraft may also affect its accuracy. The OAT probe on my RV-8 is installed in the fresh-air scoop on the bottom of the right wing.
OAT Probe Recovery Factor
The IOAT is usually higher than the OAT, because the moving air comes to a stop against the front of the OAT probe, and the air pressure and temperature increase as the air stops. The increased air temperature warms the OAT probe, so it indicates a value greater than the OAT. If IOAT is in degrees C, and TAS is in knots, IOAT = OAT + K x (TAS2) / 7592, where K, known as the recovery factor, is the fraction of the theoretical ram temperature rise that is actually realized. If the OAT probe is fully exposed to the airstream, the recovery factor is probably between 0.7 and 0.9.
The approximate OAT probe recovery factor can be determined via flight test. The data from the static system error flight test may also be used to determine OAT probe recovery factor, but only the points flown at a single altitude on a single flight may be used. Fly a series of test points, all at the same altitude, with as wide a range of speeds as possible, from just above the stall to the maximum speed in level flight. Stabilize at each speed until the IOAT indication is no longer changing. Record the pressure altitude, IAS and IOAT at each test point. Use the OAT_K_factor_determination.xls spreadsheet to determine the OAT probes recovery factor. The average of three sets of data showed a recovery factor of approximately 0.5 on the authors aircraft, with the OAT probe partially shielded from the airflow. The results on other aircraft will vary, depending on the type of OAT probe and where it is mounted.
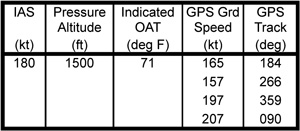
Table 1.
TAS Determination
Use the spreadsheet SSEC_Kitplanes.xls. For each speed, enter the IAS, pressure altitude, IOAT, GPS tracks and ground speeds in the first tab, Flight Test Data. Review the results, and throw out any that have standard deviation values of 1.0 or higher. If need be, do another test flight or two, until you have results with acceptable standard deviation for the whole airspeed range.
The TAS results for the 180-knot IAS test point are in Table 2. Note that the four calculated wind speeds and directions are quite similar, and the standard deviation is small. This tells us that the data quality is good. Table 3 is a summary of the results for all speeds.
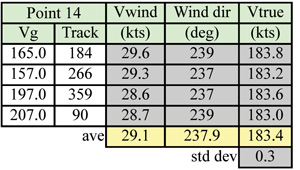
Table 2.
Note that the standard deviation for most of the test points is quite low, which indicates that the data is credible. However, the data for 170 KIAS has a standard deviation of 2.1 knots, which means that something went wrong during that test point. Perhaps a mistake was made when recording one of the numbers, or the aircraft wasn’t properly stabilized on speed, on a steady heading, or there was a wind shift. Well analyze the data for 170 knots out of curiosity, but we will consider it to be invalid.
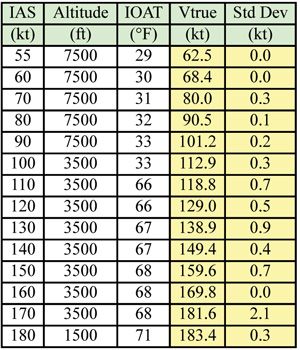
Table 3.
Data Analysis
Switch to the Data Analysis tab, and fill in cells E6 through E12. The reference altitude is the altitude you want to correct your data to (it could be sea level, or maybe the altitude of the home airport, or perhaps a usual cruise altitude).
If the instrument errors for the airspeed indicator and altimeter are known, enter them. Airspeed indicator instrument error goes in column C. It is positive if the correct ASI reading is greater than the indicated value. Similarly, the correction (if known) for altimeter instrument error goes in column G (the instrument error is positive if the actual pressure altitude is greater than the indicated value).
The EFIS ASI instrument error chart for the authors aircraft shows a -0.8 knot error at 180 knots IAS, which was entered in column C of the Data Analysis tab. The EFIS had extremely low altimeter instrument error when checked by my avionics shop, so zero was entered for altimeter instrument error in column G.
Results
The results are in columns U through AB of the Data Analysis tab: CAS, and total airspeed system error at the test altitude. If the ASI instrument error was entered, the pressure altitude, airspeed position error, and altitude position error at the test altitude are also displayed, along with the airspeed position error, total airspeed system error and altitude position error at the reference altitude.
The IOAT for the 180-knot IAS test point was 71 F. The calculated OAT in column N was 67 F, thus there was 4 F of ram temperature rise. The CAS at the test condition was 177.3 (column V). The static system position error in airspeed was -1.9 knots, for a total airspeed system error, including ASI instrument error, of -2.7 knots (columns W and X). These errors are negative, so the CAS is less than the IAS. The static system position error in altitude is -33 feet (column Y). The barometric altitude is 33 feet lower than the indicated altitude.
The airspeed and altitude system errors caused by static system position error on the authors aircraft are shown in Figures 2 and 3. The total error in the airspeed system (ASI instrument error plus static source position error) is shown in Figure 4.
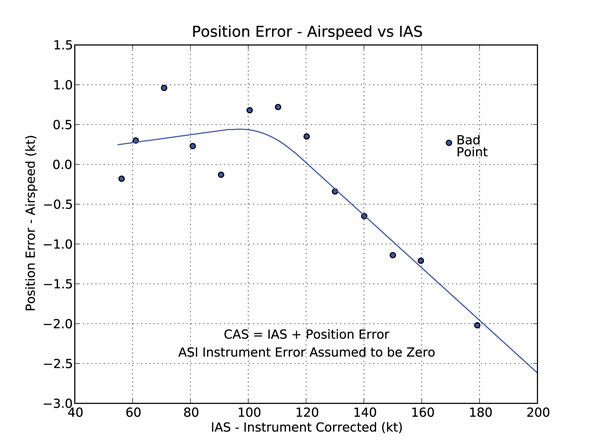
Figure 2.
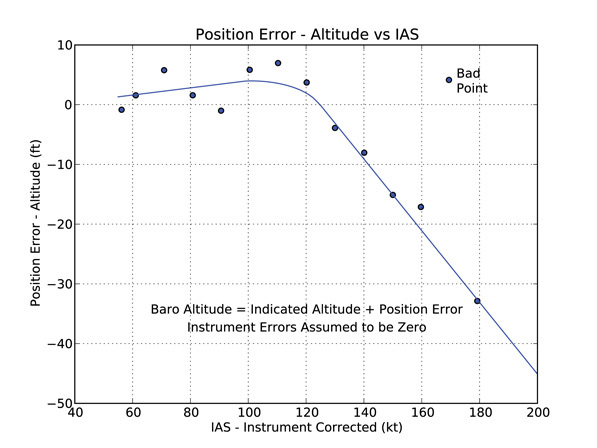
Figure 3.
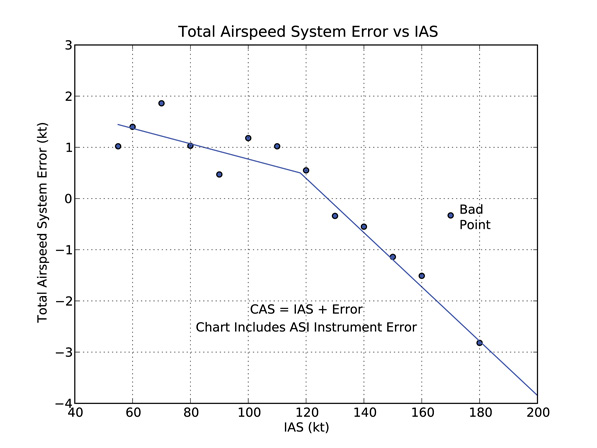
Figure 4.
Correcting Static System Error
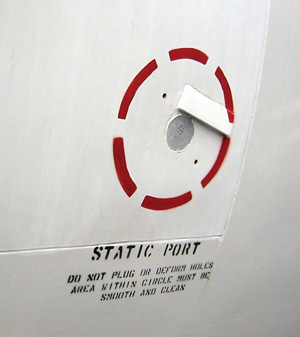
Figure 5.
If the airspeed and altitude errors are too large, we need to find a way to create a different pressure at the static port. It isn’t usually practical to move the static port, as there is no way to know which location will produce a more accurate static pressure. The only hope is to change the airflow pattern to produce a different pressure at the existing static port.
If the static pressure is too low (producing IAS and altitude that read too high), you can put a dam behind the static port to increase the pressure at the port. Experiment with the dam height, angle and distance behind the static port to find the geometry that gives the desired result. Rotating the dam around the static port will change the speed range where it has the most impact.
If the static port is on a pitot-static tube, find a piece of aluminum tubing that has an inner diameter just slightly smaller than the pitot tube. Cut off a ring of tubing, cut a slot in it, and polish all edges. Twist a screwdriver blade in the slot to expand the ring and slip it over the pitot-static tube until it is behind the static port. The effect of the ring can be varied by adjusting how far behind the static port it is.
If the static pressure is too high (producing IAS and altitude that read too low), the dam or pitot-static tube ring has to be placed ahead of the static port.
Hand- v. Computer-Recorded Data
Its interesting to compare the hand-recorded data used in this article against data that was recorded by a laptop computer on the same flights. The laptop recorded data from the EFIS, GPS and engine monitor. Several seconds of data on each leg were averaged and used to calculate the static system position error. The results for the hand-recorded and computer-recorded data can be compared in Figure 6. The results are similar, except for the expected difference at 170-knot IAS, where the hand-recorded data had a large standard deviation. Most of the other test points differ by less than 0.25 knots. This shows that while it is useful to have computer-recorded data, it is possible to obtain quite similar results using data recorded by hand.
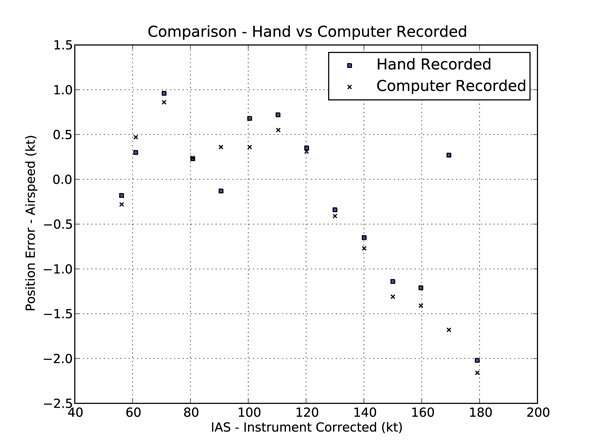
Figure 6.
Conclusion
The static system on your aircraft certainly has some error. Maybe the errors are small, or maybe they are large. Why not invest one or two flights worth of your time to find out what those errors are? Future articles will present other flight test techniques, using real world data from my RV-8 as an example.

