Because few pilots (and fewer passengers) like a turbulent ride, we tend to spend a fair bit of our weather briefings looking for signs of turbulence along the intended route. You have your AIRMETS, of course, but they’re broad and generally more predictive. You have SIGMETs for turbulence when a number of aircraft report certain, usually extreme, conditions. And you have pilot reports, PIREPS, that can help fill out the picture. But PIREPS can be few and far between. I’ve provided ATC with more than a few that never seemed to make the system, usually when it’s an “all’s well, smooth up here” kind of report, which I still want to know about!
ForeFlight has added some data to the mix with the new Reported Turbulence feature. How it works is actually quite clever, borrowing a page from the way Google provides traffic information to Google Maps. If you have the latest version of ForeFlight and are using a Sentry or Sentry Plus to provide GPS and ADS-B In data, the software will use the data derived from the Sentry’s AHRS sensor pack. In essence, it’ll look at physical disturbances of the Sentry module and, after processing it in software, produce an outcome that suggests a smooth ride or three levels of turbulence in the commonly understood rankings: light, moderate, severe or extreme.
 Great. So how does ForeFlight get the data into the larger ecosystem? It depends on an internet connection, which can be a little tricky. For most, this means having ForeFlight automatically upload the data as soon as whatever device it’s on gets connected. So after the flight, assuming your iPhone or iPad connects, the data will upload to ForeFlight and begin appearing on other pilots’ devices.
Great. How do they see it? One of two ways, first you can use the “pack” feature before departing. That brings in all the weather and ancillary data to ForeFlight to review in flight even if you don’t have connectivity up there. The other is to have a live internet connection in flight. Truth is, many modern phones are capable of useful internet on 4G/LTE or 5G in many places; I’m often surprised to hear my phone buzz at 12,000 feet telling me I have a new, ready-to-be-ignored Slack message. If you have data, ForeFlight will send your captured data up and it should appear in the system. In theory, in a perfect world, one pilot ahead of you with airborne internet will experience certain conditions and you, behind him, might see it appear on your ForeFlight if you also have a signal.
The less perfect world we live in means many of the data points are fairly old. ForeFlight sets a limit of 6 hours and marks each data point with a location, altitude, time it was taken and aircraft type, which comes from the default aircraft you have set in ForeFlight. Now would be the time to admit your Cessna 150 is not, in fact, a Gulfstream.
Moreover, the setup gets a little confusing if you mainly use ForeFlight on an iPad that doesn’t itself have cell-data capabilities, meaning you have the Wi-Fi-only version. Sentry connects via Wi-Fi, so even if you could get your phone to work as a hotspot in flight, the iPad won’t see it because it’s connected to the Sentry. For my testing, I had my iPhone linked to the Sentry so that it still had a possible internet connection. It would also work if you had an iPad model with internal cell-data capability and a working data plan.
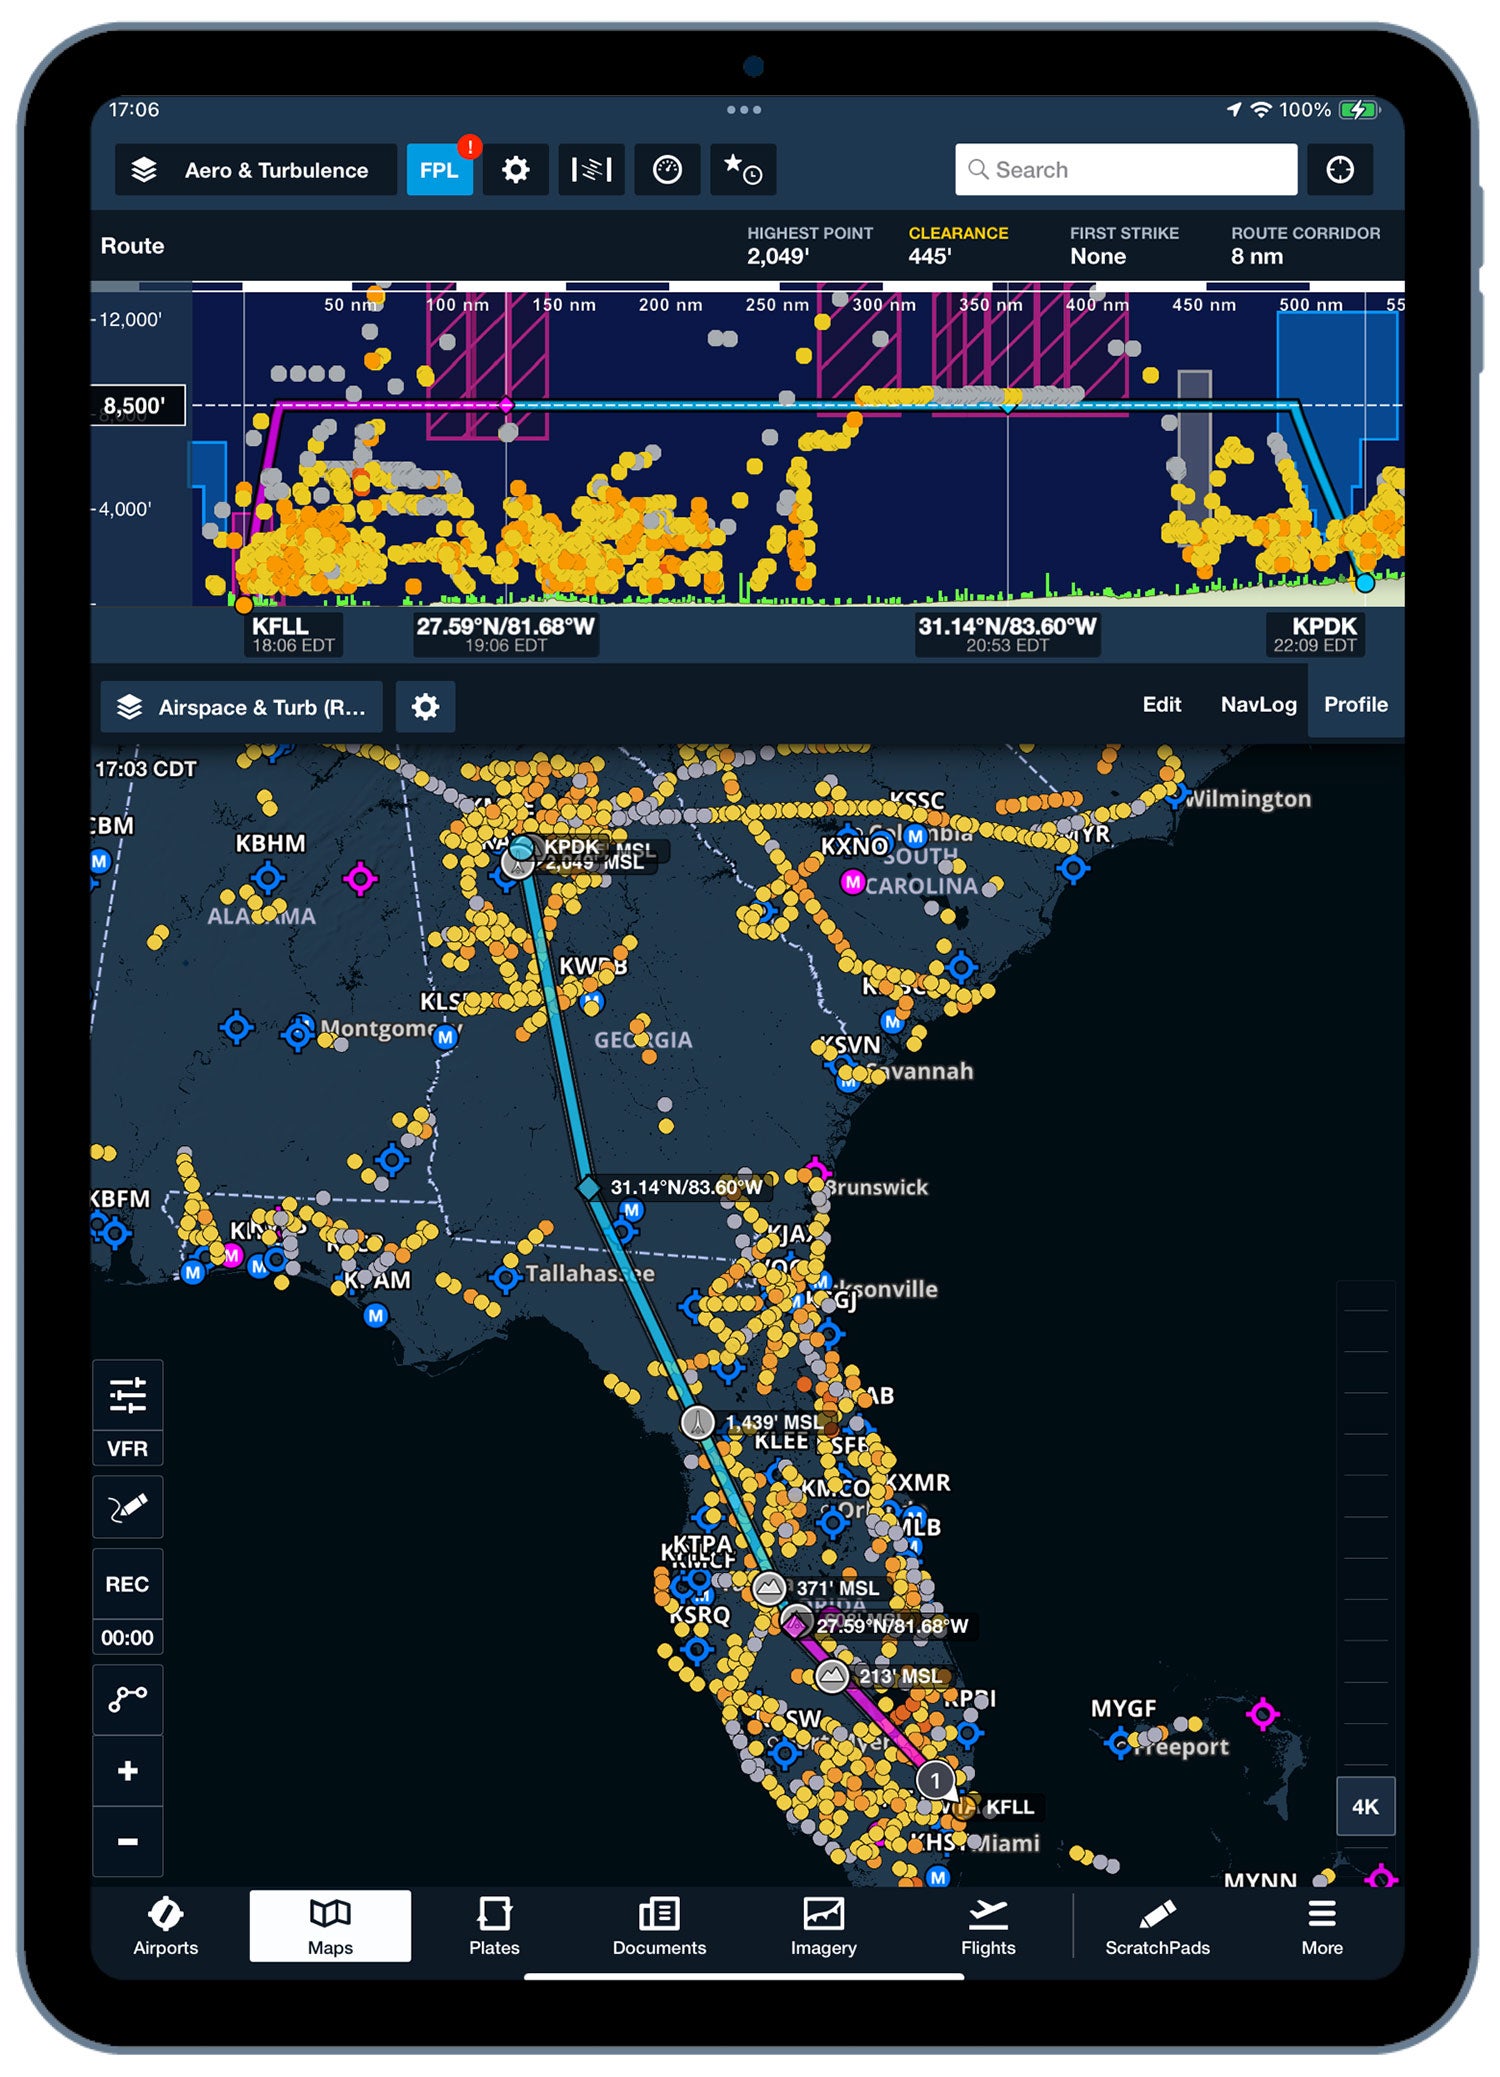
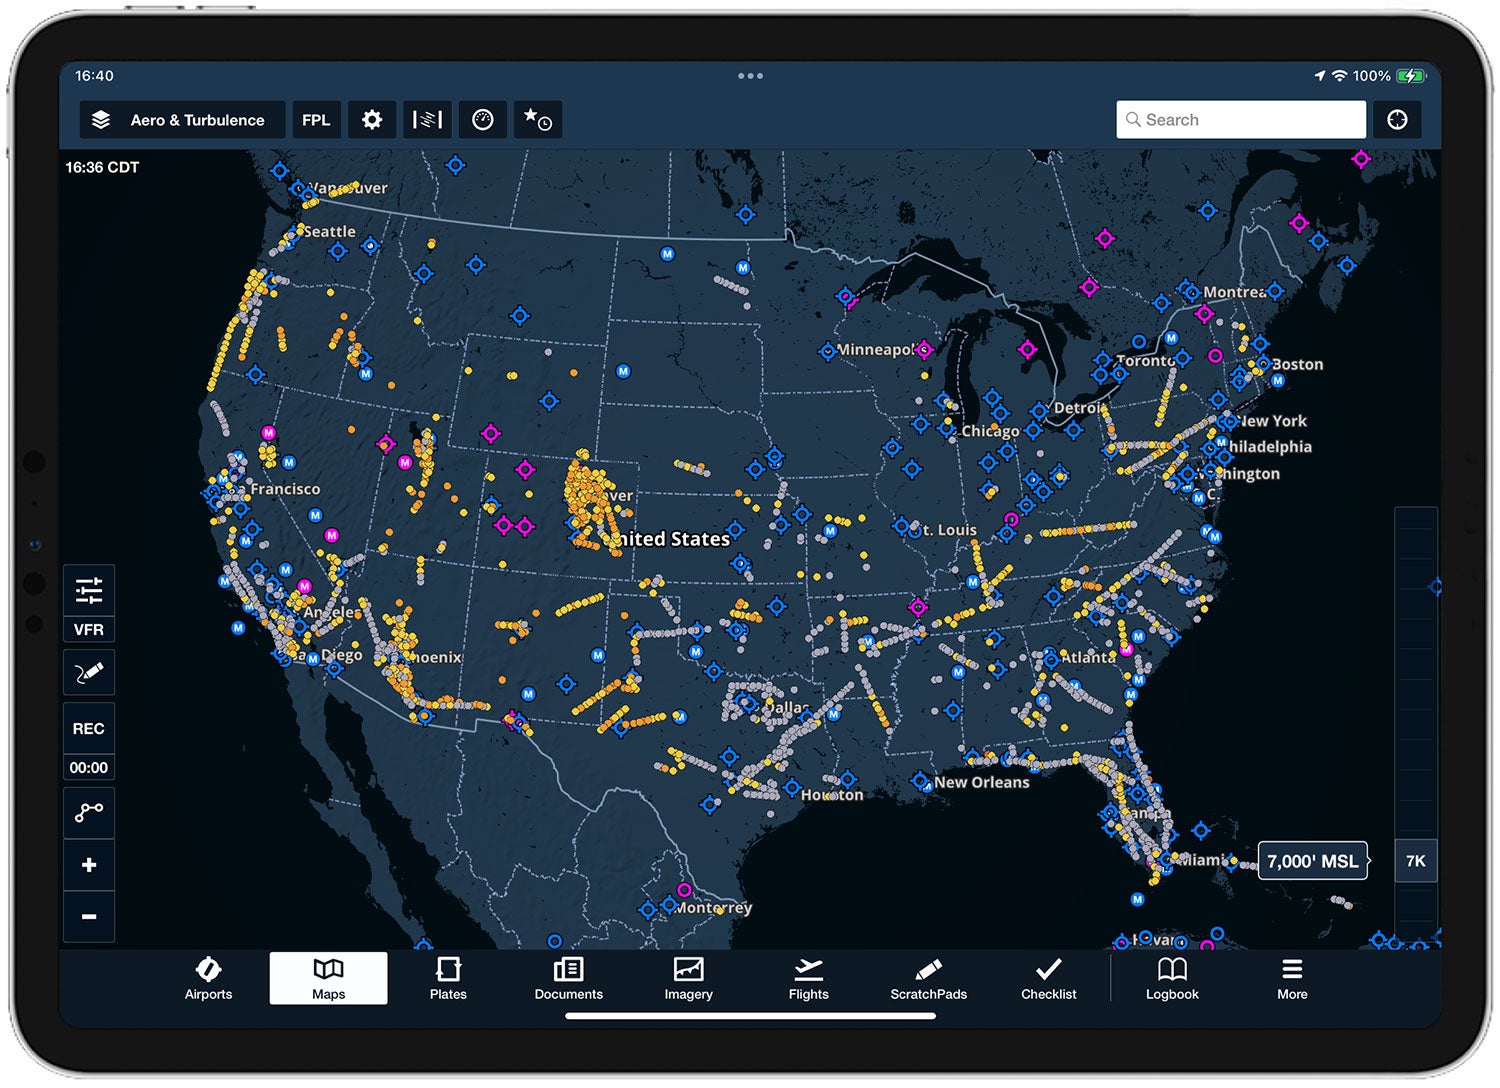
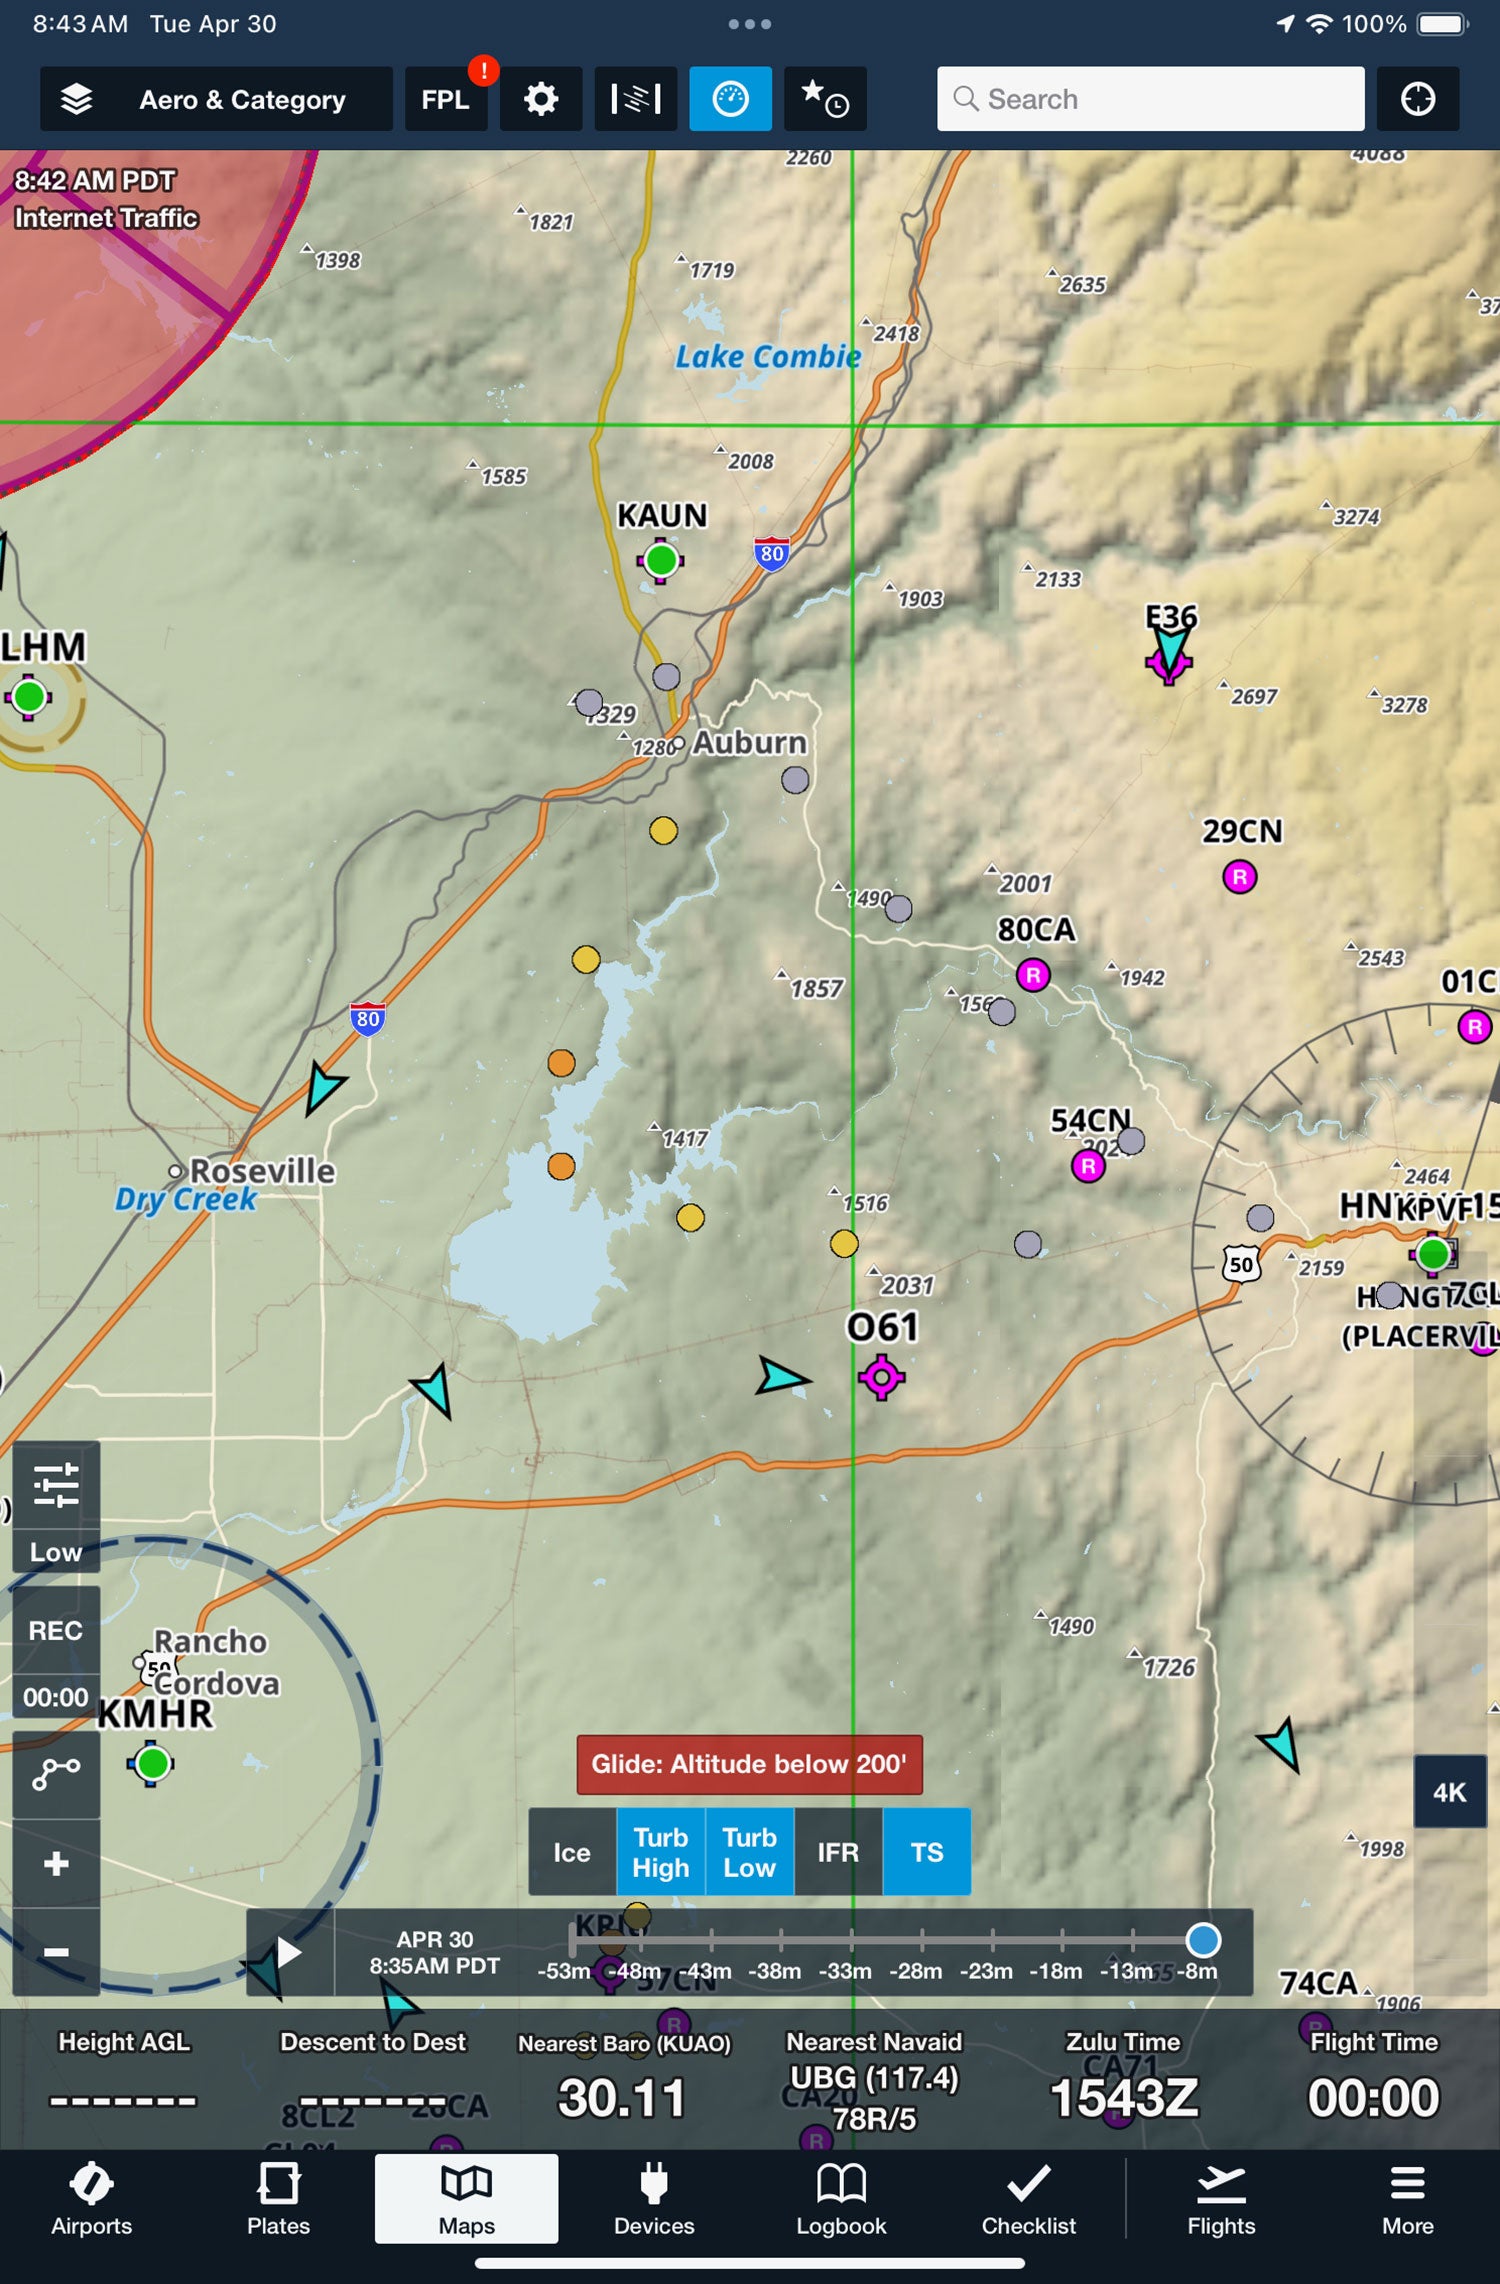
A few other observations. The Reported Turbulence data appears as colored dots on the screen (and can be turned off to reduce clutter if you want) that open into more detailed menus when you tap them. There is a slider on the right side of the screen to select altitude, at this time only 1000, 4000, 7000, 10,000 and 13,000 feet for the free version that stops coverage at 14,000 feet. In flight, an Auto feature syncs to the nearest value according to your GPS altitude. Tap on any of the dots and the detailed info box pops up with the calculated turbulence, age of report, altitude where it happened, aircraft type (no N numbers), wake category and airspeed. Below the main panel will be a list of nearby reports that hint there are more reports in the system than are shown in the main view, which is probably to keep clutter at bay.
Overall, this is an interesting technology to help fill out the other turbulence data a pilot has available—in addition to a good sense of wind flow over terrain and knowing when not to fly under that ugly black-bottomed cloud. It depends on some technology that not every airplane has: an active ForeFlight app and a Sentry unit. At this time, ForeFlight doesn’t do anything with the data supplied by other AHRS devices you might already have in the cockpit. So it’s possible there’s a Cherokee up ahead of you with the student and flight instructor trading blows with the headliner that you’ll never know about unless you overhear their quavering voices on approach frequency.
As mentioned, this is a free feature for the low-altitude version for users with the Pro Plus or Performance Plus subscriptions—$240 and $360 a year, respectively. And assuming you already have a Sentry or Sentry Plus, which will need an easy over-the-air firmware update to make it functional with Reported Turbulence. For pilots seeking a smooth experience, Reported Turbulence might not be the most used tool in the box but it’s a promising way to get additional data to help you form a more detailed mental picture of the ride ahead of you.


I enthusiastically registered my Sentry and paid for the high altitude turbulence model. My experience was that is worthless to me. Data that I saw was never less than an hour old, usually, 4-5 hours old, which to me is useless for flight planning. I hope it gets better because the idea seemed good, but I couldn’t see the advantage of using hours old data for flight planning.
It’s possible that the turb died down, so no newer reports.
There is an app (on Apple, don’t know about Android) called Virga that shows PIREPs on a map. You can adjust the time frame of what is displayed. Of course, what really makes a PIREP useful is to report them, not just read them, even when not bad weather. They do help forecasters validate and adjust their models.
Comments are closed.