The genesis of this article comes from two sources. First, at the National Test Pilot School where I work, we run a course for the FAA, and a couple of years ago, they requested that we add a simulated icing sortie to their syllabus. This was done using a Cirrus SR-22 with great effect. Second, on a couple of occasions I’ve picked up a little rime ice when cruising IFR in my Van’s RV-8, and I’ve wondered how significantly a small amount of ice would affect the aircraft.
A full-blown icing certification program is a large undertaking. These campaigns typically start out with modeling and simulation, wind tunnel tests, and progress to flight trials with synthetic pre-activation and icing shapes. Next comes flight in VMC behind an ice spraying aircraft, culminating with flight in actual icing conditions. Nearly all of this is well beyond the recourses of the average homebuilder.
Given that most homebuilt aircraft don’t have anti-ice or deice equipment, the first sign of icing should lead us to beat a hasty retreat from those conditions. The purpose of this experiment was to investigate how even a very small amount of icing could affect the performance and handling qualities of a typical homebuilt aircraft.
I used 40-grit sandpaper on the leading edge of the wing and horizontal and vertical stabilizers to simulate a light accumulation of icing, commonly known as pre-activation ice (the amount of ice you would let accumulate before you activated deicing equipment, like inflatable boots). This is what we used at NTPS for our demonstration sortie on the Cirrus. While this modification method provides an accepted simulation of the aerodynamic changes from a light-icing encounter, it does not change the aircraft’s weight significantly. This means that the changes due to a real icing encounter are likely to be worse than experienced here. For this trial I put the sandpaper along the entire wing leading edge. However, in practice I have found that the relatively warm fuel in the wing tanks has kept the inboard leading edges clear (for a short time at least), and ice has only accumulated on the outboard part of the wing. But I live in Southern California, where it is mostly warm. Someone whose aircraft has been parked outside in cold conditions probably won’t see this effect.
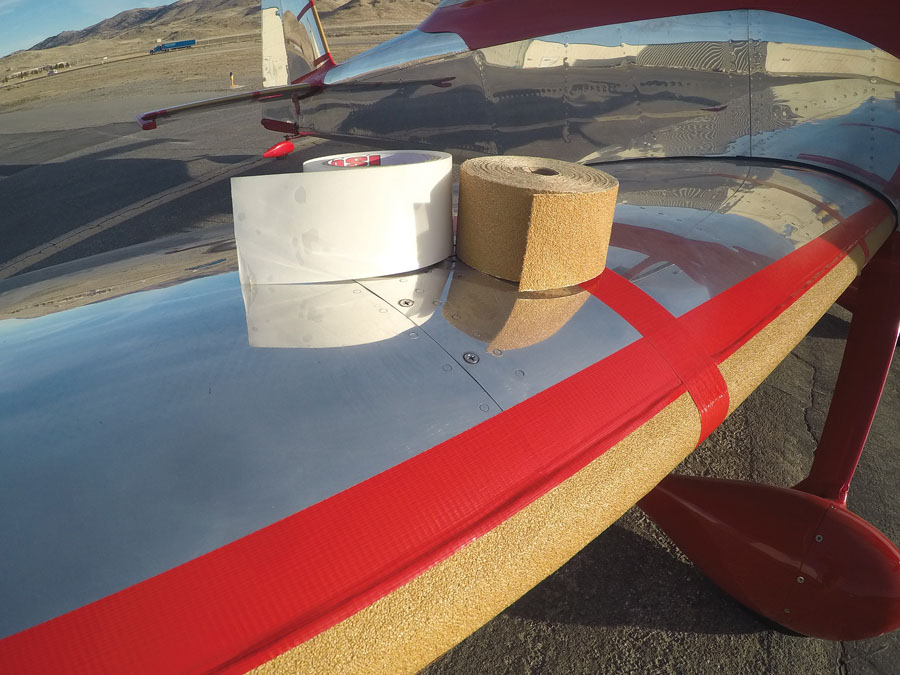
Sandpaper simulates ice on the wing leading edge. To prevent scratching, 3M clear vinyl tape was applied to the wing, then the sandpaper was placed over the vinyl.
The sandpaper was purchased from Amazon in a 20-yard roll of 2.75-inch-wide paper-backed adhesive. As the adhesive picked up some grit from the layer below, I first applied a 3-inch wide strip of 3M clear vinyl tape and then laid the sandpaper on top. This prevented the adhesive side of the sandpaper from scratching the surface of the wing. The sandpaper was quite stiff and hard to roll around the tight radius of the leading edges, so I used tape to seal the edges and prevent it from coming off in flight.
Prior to commencing this test, I sought the council of my peers who had done icing certification tests and reviewed icing test reports and NASA research papers. NASA/TP-2016-218348, Ice Accretions and Full-Scale Iced Aerodynamic Performance Data for a Two-Dimensional NACA 23012 Airfoil, dated April 2016, was particularly insightful. In this trial an 11.5-foot span and 6-foot chord model (approximately the same size as the wing on my RV-8) was tested with a variety of ice shapes in a wind tunnel over a range of speeds and angles of attack (AoA). At speeds relevant to an RV-8, the clean airfoil stalled at 18 AoA, producing a maximum coefficient of lift (CLmax) of 1.8. The addition of “roughness ice” on the leading edge reduced the stall AoA to 11 and the CLmax to 1.1.
I flew two sorties, the first one being a baseline without the ice simulation. The second one was identical in content but had the sandpaper attached to the wing and stabilizer. Each sortie was started with 30 gallons of fuel for a takeoff weight of 1530 pounds and CG at 79.8 inches (forward). The maneuvers I flew were:
- A timed climb from 7000 feet to 10,000 feet to determine the effect of ice on climb performance.
- Level flight to check cruise performance.
- Stalls with flaps at 0, 20, and 40 to check the effect on stall warning, stall speed, and stall characteristics. These stalls were done power off and power on, both wings level and turning at 30 angle of bank.
- Longitudinal and lateral/directional static stability in cruise and landing configurations.
- Glide performance.
Climb
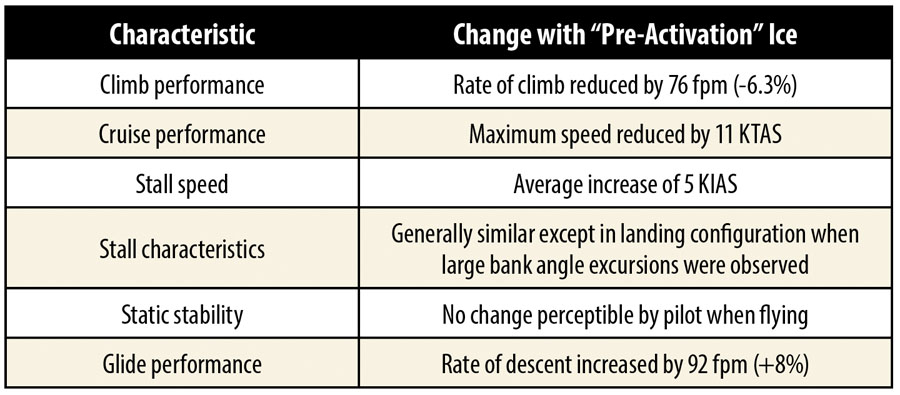
To measure the effect of icing on climb performance I timed climbs at Vy (100 KIAS) from 7000 feet to 10,000 feet. I flew these with wide-open throttle (WOT), 2500 rpm, and mixture rich. Normally I am leaning by these altitudes, but using full rich made the test more repeatable. Clean, the average climb rate was 1210 feet per minute (fpm). The addition of ice reduced the climb rate to 1134 fpm, a reduction of 76 fpm (6.3%). Note that this test only modeled the drag increase and makes no account of the increase in aircraft weight due to ice. So my results are optimistic. In reality I would expect the decrease in climb performance to be larger.
Cruise Performance
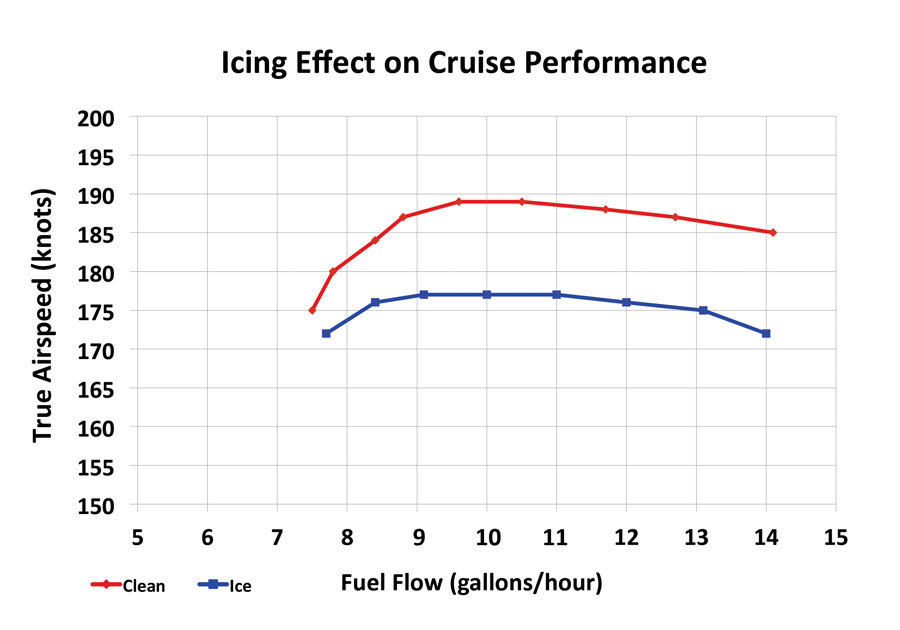
I conducted cruise performance at 10,000 feet with wide-open throttle and 2500 rpm. Starting with mixture full rich, I leaned the mixture in ~1 gallon-per-hour steps until the onset of roughness. The clean aircraft had a maximum speed of 188 KTAS and best range of 23.3 nautical miles per gallon. The addition of ice shapes reduced the maximum speed to 177 KTAS (-11 KTAS) and the best range to 22.3 nautical miles per gallon (-1.1 nm/gal). In practical terms, the addition of light ice has about the same drag penalty as flying an RV without the wheel fairings. If you pick up icing, the increase in drag could make the difference between arriving at your destination with healthy fuel reserves or coming up short.
When clean, maximum speed was 188 KTAS and best range was 23.3 nautical miles per gallon. The addition of ice shapes reduced maximum speed to 177 KTAS (-11 KTAS) and best range to 22.3 nautical miles per gallon (-1.1 nm/gal).
Stalls
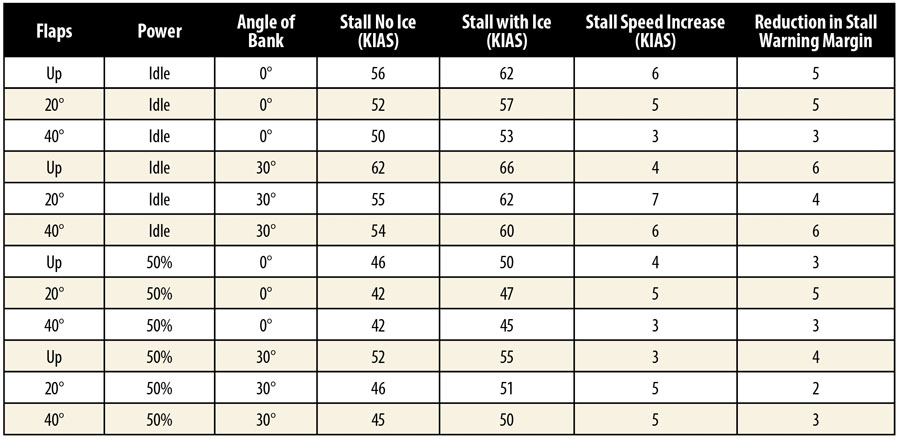
I conducted stalls in a range of configurations to determine the effect on stall speed, stall warning margin, and stall characteristics. Stalls were conducted wings level and turning at 30 angle of bank, with idle power and 50% power (18 inches manifold pressure, 2500 rpm and 10.5 gph). In each condition the stalls were conducted with a 1 knot per second deceleration rate and with flaps at 0, 20, and 40. In all cases, addition of ice resulted in a stall speed increase. The increase in stall speed ranged from 3 to 7 KIAS (average increase 4.7 KIAS). In each case, the margin between stall warning and the stall was reduced. This reduction in stall warning margin ranged from 2 to 6 KIAS (average reduction 4 KIAS). In most cases, the behavior at the stall was not altered. However, in the landing configuration, with power on and turning the aircraft, it was a different story. In this case the aircraft would rapidly roll to 90 bank angle at the stall. This is markedly different behavior than the clean aircraft. When clean, the aircraft always rolls toward wings level when stalled in a turn. In the traffic pattern, with ice on the wings, my aircraft would give far less warning of an impending stall and would stall at a higher airspeed than normal with far more severe consequences.
With ice, stall speed increased 6 knots, maximum AoA was reduced 10%, and margin from stall warning was reduced 5 knots. The black line indicates elevator position: 0% is stick full forward, 100% is stick full aft. In both cases, the stick was full aft at the stall.
Static Stability
I measured static stability (longitudinal and lateral/directional) in cruise and approach configurations. Although I can see some subtle changes when I review the recorded data, there was no perceptible difference when flying the aircraft. This could be a mixed blessing. The good news is the static stability of my aircraft does not change with the addition of light icing. The bad news is that because the stability does not change, I might be lulled into a false sense of security and mistakenly conclude that the overall aircraft performance and handling has not been altered, when in reality other aspects of the aircraft have been significantly degraded.
Glide Performance
Glide performance was measured at 100 KIAS using timed descents from 10,000 feet to 7000 feet with throttle at idle and propeller at minimum rpm. Clean, the aircraft descended at 1166 fpm. With ice, the rate of descent increased to 1258 fpm, an increase of 8%.
Safety
When conducting a test that could degrade the aerodynamic performance of your aircraft, you should be prepared for surprises. Pay particular attention to the skid ball when stalling. Practice spinning and recovery before you embark on a modification program that will likely alter the stall characteristics. Build up the level of aggression, i.e., do power-off stalls before power-on stalls and wings-level stalls before turning stalls. Use the longest runway available for takeoff and landing, and increase the climb-out and approach speeds. If your aircraft has a laminar flow wing, altering the leading edge shape or finish will likely result in more adverse changes than I observed in my RV-8.
Options to Exit Icing Conditions
If you need to get out of icing conditions, you really have three options. These are up, down, or back. Climbing can work if you are sure there are clear conditions above. The trouble is that ice degrades climb performance, so it will take longer than normal, or at worst prevent you from climbing to clear conditions. Climbing still leaves you with the problem of having to descend through icing conditions later.
If you were in previously clear conditions, a good option is to turn around and go back. This is fine, as long as the conditions behind have you have not changed. You are also now heading away from your planned destination.
Descending can be a good option, but it only works if you can get below the freezing level before running into the ground. For most experimental aircraft, a good rule is to avoid flying in cloud unless you can do so below the freezing level and, if necessary, descend into VMC conditions above the lowest safe altitude for the route. This means that the down option always remains open.
Conclusion
While the general outcome was pretty predictable, I found this to be an interesting test to conduct, and it left me with no doubts about the severity of flying my RV with ice. Icing conditions in an RV are a bad situation, and you should avoid them. If you find yourself accumulating any amount of ice, you should act immediately to exit the conditions. The sandpaper simulation I used likely does a good job of simulating the aerodynamic changes of a light icing encounter. Real icing, with its significant weight penalty and potentially more adverse aerodynamic effects, could degrade the aircraft much more than seen in this trial.
If I need to land my RV with some ice on the wings, I will do so with flaps up, use a higher approach speed, and a wider pattern that requires lower angles of bank. Of course, if there is a possibility of ice, a far better option is to leave the RV in the hangar and slum it with the common folk on a commercial airliner that is designed, equipped, and tested for icing conditions.








Outstanding Nigel. Very interesting. I live in “ice alley” on the border of Oregon & California and also fly an RV-8A (A model = Assume!) which I use regularly to commute to work flying helicopters during fire season and general travel. Departing out of Medford KMFR during the winter IFR in IMC is practically speaking, unavailable. Too cold-below freezing levels and a lot of visible moisture! However, the other seasons allow for IFR to get through layers nicely and make for real practical use of the plane, plus its just FUN. Having spent 1,400 hrs now commuting around the area in the RV, I’ve had run ins with light ice and often wondered about the effects in terms you laid out so well. Good On Ya! Thank you for sharing your results and keep it up. Now, if I could only get an RV to use down here in Australia during fire season to commute around in when we are here with the Aircranes, I’d be able to play tourist more and see all the neat places without having to “slum it” on the commoners craft.
Cheers Mate!