How fast does your aircraft go? You could grab your trusty E-6B and use your airspeed indicator (ASI) reading, pressure altitude and outside air temperature (OAT) to calculate true airspeed (TAS). But if you are flying an Experimental/Amateur-Built aircraft, you may not know what the static source position error is. And your ASI probably has instrument error. What is a guy to do? The GPS is the answer. We can use the groundspeed information from the GPS to calculate TAS, as long as we are careful to use a method that is mathematically sound.
What Not to Do
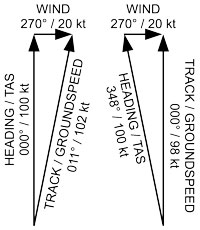
Many folks intuitively believe that the average of GPS groundspeeds from runs on the four cardinal compass headings will equal the TAS. Sorry, but that is wrong! It only works if the wind is zero. To help understand the source of the error, lets imagine an aircraft flying at a TAS of 100 knots. The wind is 20 knots from the west. The pilot flies on headings of 000, 090, 180 and 270 and records the GPS groundspeed. When he is heading west, into wind, the groundspeed will be 80 knots. Heading east, the groundspeed will be 120 knots. So far, so good. The average is 100, the same as the TAS. But what happens on the north and south legs?
On the north leg, the wind triangle (Figure 1) shows that with the wind at 90 to the heading, the track arrow is longer than the heading arrow-the groundspeed is 102 knots on both the north and south legs. The groundspeeds on the N, E, S and W legs are 102, 120, 102 and 80, for an average of 101 knots. The TAS was 100 knots, so clearly the average of groundspeeds on the four cardinal headings is not equal to the groundspeed. The error is low if the wind speed is low, but the error increases quickly as the wind speed increases.
If instead of flying the four cardinal headings the pilot flies four cardinal tracks, there is still an error. Only this time, because the pilot needs to turn into the wind to force the track to be north and south, the groundspeeds on those legs are less than the TAS, and the average of the four groundspeeds is 99 knots (Figure 2).
Math Works!
Mathematically sound methods have been published that rely on GPS groundspeed data from three legs with headings 90 apart, i.e. three sides of a square box (Horseshoe Heading Technique, David Rogers, 2002). See the Resource list at the end of the story for more information on methods. An accurate method that relied on data from three legs on tracks 90 apart was also published in this magazine (Is Your Speed True by David Fox, February 1995). Both of these methods work, but the one requiring legs on specific headings relies to a certain extent on the accuracy of the magnetic compass. Further, both methods require that the pilot take care to accurately fly the correct headings or tracks.
Doug Gray’s Method
Doug Gray, an Australian RV-6 builder, developed a very useful method that can use GPS data from three legs on arbitrary tracks (Using GPS to Accurately Establish True Airspeed, Doug Gray, 1998). The inputs are the GPS groundspeed and track on each leg, and the outputs are the TAS, wind speed and wind direction. Secondary outputs are the headings on each leg, which can be used to check the accuracy of the compass. Grays method has the advantages that it does not rely on magnetic compass accuracy, nor does it require the pilot to accurately fly a target heading or track. However, each leg must be on a constant heading long enough for the GPS groundspeed and track calculations to stabilize.
NTPS Spreadsheet
The National Test Pilot School was using another GPS-based method when I was there for a refresher course in 2001. I introduced NTPS instructor Greg Lewis to Grays approach, and the NTPS quickly recognized its superiority over other methods of calculating TAS from GPS data and made a clever addition to this method: They gather data on four legs and use the redundant data to provide a data quality check. The NTPSs spreadsheet does four TAS calculations using data from different combinations of three of the four legs. If the data is good, all four calculations should yield similar TAS and wind. But if there is a problem with the data, the four TAS and wind calculations will vary, and all data from those four legs should be discarded. The data could be bad for many reasons: error recording GPS data, actual TAS not the same on all four legs, data recorded before the calculated GPS groundspeed and track had fully stabilized, aircraft heading changing instead of being constant and poor air quality due to turbulence or wind variations.
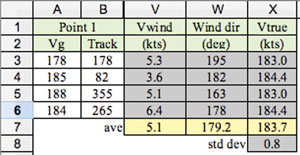
The spreadsheet has three tabs. The Three Legs tab is for calculating TAS with data from three legs, using Grays method. This tab also has notes that explain the abbreviations used in all tabs. The Four Legs tab employs the four-leg variation of Grays method (See excerpt in Figure 3). Four GPS groundspeeds are put in the Vg column, and the four GPS tracks are put in the Track column. The four calculated winds and TASs (Vtrue) are shown to the right, with the average TAS and wind below. The std dev (standard deviation) value below the average TAS is a measure of how much the four TAS calculations differ. Small standard deviation values indicate good quality data. Ideally, the standard deviation would be 0.5 or less, and the data should certainly be thrown out if it is greater than 1.0. The last tab, PEC, is used to calculate pitot-static error corrections, which will be the subject of a future article.
Flight-Test Details
This flight test requires extremely smooth air. Choose a test area that should have minimal traffic. The pilot will be working hard to accurately fly the aircraft, so it would be helpful to carry an observer, if possible, to record the data and to help keep a watch for other aircraft. The use of an autopilot should give better quality data and help reduce pilot workload.
There are two usual purposes for conducting this type of flight test: determining TAS versus power or as part of a static-system position error flight test. Future articles will provide expanded coverage of both these subjects. The flight test for static system position error is easier to conduct than the one for power versus TAS, as the power can be varied as required to stabilize at the target IAS. It is important that the IAS for each leg be as close as possible to the target IAS, as the analysis method assumes all legs are at exactly the same TAS. The altitude should be close to the target altitude, but it may be varied 50 feet from the target if necessary to achieve exactly the target IAS.
If the purpose of the test is TAS versus power, then the power cannot be varied, and the pilot must be patient on each leg to allow the aircraft to slowly accelerate to the stabilized IAS. Note the IAS on each leg, and ensure that they are all the same.
Conclusion
If you are going to take the time and burn the fuel to gather GPS data to calculate TAS, you might as well use a method that actually works. Take the time to download the NTPS spreadsheet. It can be opened using Microsoft Excel, the free OpenOffice for Windows, Linux or OS X, or NeoOffice for OS X only). Use the four-leg method described above, as it allows the quality of the data to be checked. May your aircraft fly faster than you expected!









Interesting read. I posted onto a UK Microlight group and had an interesting reply from a chap who published an article with more detail a few years back
https://bura.brunel.ac.uk/bitstream/2438/937/1/Gratton%20GPS%20AeroJ%20V2%20Feb%202007%20A%20FINAL.pdf?fbclid=IwAR1lVG1c4RgoNhit7ebn-cu04UMGwUbHwLv9-YNYAPw80eQFFGu5syIFEdo
Note that the embedded link in the article for the ntps spreadsheet foes not work:
http://www.ntps.edu/Files/GPS%20PEC.XLS
NPS spreadsheet available at: https://www.ntps.edu/images/stories/documents/GPS_PEC.xlsx
The spreadsheet linked, both in the article and in the comments from 2020 and 2021, does not work. Calculation functions appear to have been stripped out. Anybody have an updated link to a working spreadsheet file?
Try this link: https://www.kilohotel.com/rv8/rvlinks/GPS_PEC.XLS
Kevin,
I have a Garmin G3X in my RV14 – the Speed tape displays in real time the Ground Speed, IAS and TAS (there is also a separate icon that shows the wind direction and speed). What is your understanding of how accurate these numbers are (assuming a proper install of the system)? Should I put much faith in the TAS I am seeing?
Enjoyed your article.
Craig
I have no personal experience with any of the recent Garmin products, so please understand that the comments that follow may be completely wrong.
In principle, the ground speed display should be accurate, but there will be some filtering or damping on the displayed value. I.e. it will effectively represent an average ground speed over some unknown period. Thus it is unlikely to immediately reflect the current ground speed following a heading change, power change, etc.
The IAS and TAS that are displayed likely assume that there is zero position error, no leaks in the static system and zero error in the OAT probe. In other words, the displayed values may not be completely accurate.
Actually it is not TAS but CAS that you are calculating here!
Because TAS is equivalent airspeed corrected for temperature and pressure altitude.
See: https://www.skybrary.aero/articles/airspeed-conversion
The NTPS spreadsheet mentioned is not complete.
To calculate TAS, NTPS plugs-in an extra module for that.