 This is the third and last installment of our series on testing. In Part 1, we looked at performing a static load test on a wing, the kind of test that most people are familiar with. It’s a pretty straightforward test and is designed to confirm the strength of a component, not break it, or optimize anything.
In Part 2, we focused more on lab-style testing of materials that would typically be done in the early phases of design. In contrast to the wing test, these are purposefully destructive tests and usually require a variety of specialized fixtures. They are done for the purpose of characterizing materials, which gives engineers the data they need to design actual parts.
Here in Part 3, we’ll explore component testing, which can be thought of as a combination of the first two. These tests typically involve destructive testing of prototype parts in order to ensure that they meet the design requirements, as well as to further optimize the design if possible. Then, once you arrive at a final part design, that part itself should be subjected to a static load proof-of-strength test just like we did with the wing in Part 1. In comparison to the testing in articles 1 and 2, you can see that this tends to be an iterative process of destruction, followed by refinement and repeated as necessary (or until you get tired of breaking/making test pieces!).

Although I use Thor, a universal testing machine (UTM) to do most of my destructive testing, this is nice but not a necessity. Quite a few homebuilders have performed destructive testing, and most of those folks are using some combination of a hydraulic jack and a load cell or pressure gauge to apply force and measure it. So a lot of what you see in this article could be accomplished in this manner as well with a bit of work and ingenuity.

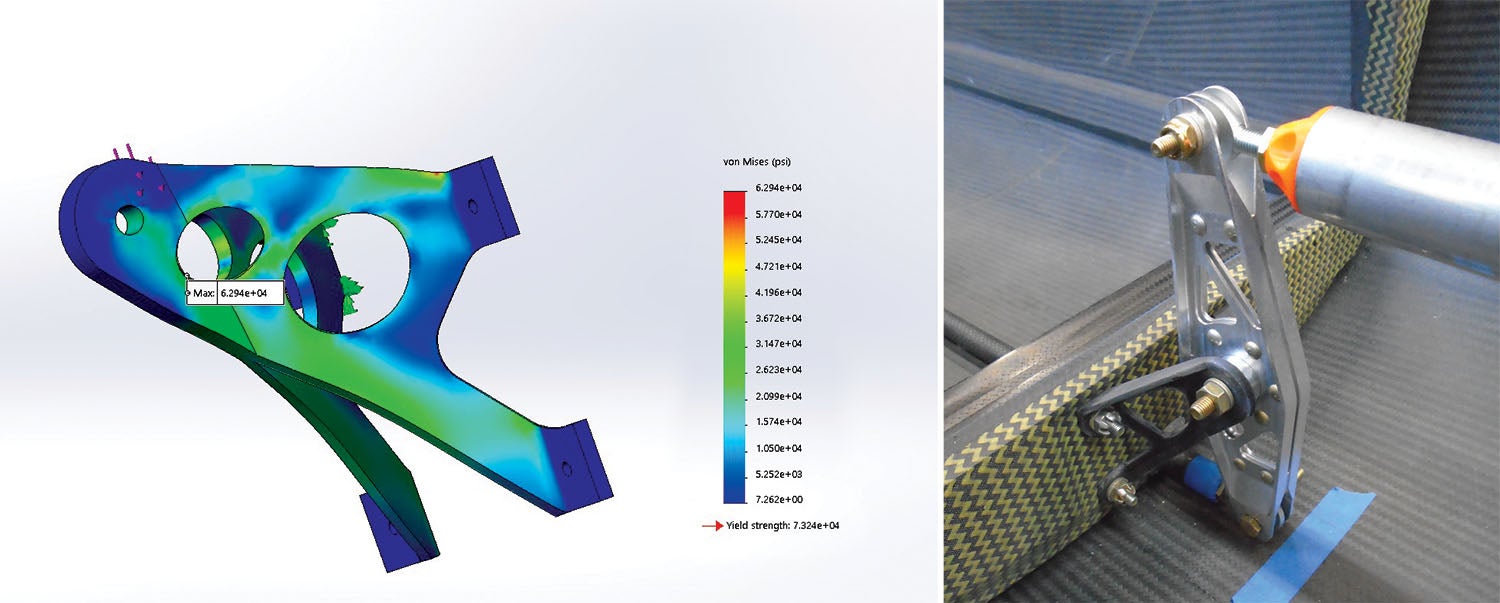
Traditionally, homebuilders have used basic hand calculations, along with a healthy margin of safety, to design airplane structures. These days we have access to user-friendly finite element analysis software such as that found in SolidWorks (available free to EAA members) to simulate stresses in parts. But without testing, you won’t know if these analyses are accurate for anything but the simplest of parts. So empirical testing helps validate your design methodology—whether it be hand calcs or FEA—and thus helps you optimize current parts as well as guide future design methodology.
A Tale of Two Tailwheels
The tailwheel shown here is a great way to exemplify the above points. In order to keep it light, the tailwheel is a simple bracket bolted to the fuselage; it has no steering or swiveling ability. I knew that some of the Formula 1 racers are set up like this, so I called Creighton King (www.cassuttaircraft.com) and discussed possible design ideas with him. He kindly sent some pictures of his own setup, and that was my starting point.

Because the tailwheel is rigidly attached to the fuselage, it was necessary for the bracket itself to offer a degree of shock absorption. This was accomplished by using unidirectional fiberglass, which is more flexible than carbon fiber. In addition, because the tailwheel does not swivel, the bracket needed to also have torsional strength to deal with side loading, so this was also incorporated into the layup schedule.
Using the published specs for unidirectional fiberglass, a quick-and-dirty proof of concept prototype was made in a press-mold. The fiberglass failed at about one-third of the listed compressive strength, but that was not totally unexpected—material properties achieved in a carefully designed lab test are often not achieved in actual parts. But now I had a value that I could use in a subsequent design.

In addition, the part failed at the point of maximum bending stress. That was expected, and it was good to have it verified. The part did not fail at the axle bushing, where I had some concern due to how the mold had deformed the laminate there. So that turned out to be less of an issue than I’d imagined. Having made the prototype, I could see the shortcomings in both the first part and first mold, and I went about modifying both.
The final part was then proof loaded on the UTM. When the part reached proof load without showing any signs of imminent failure, I had a decision to make: I could either call the part good and install it on the airplane, or continue the test to failure and use the results to optimize the part design and potentially reduce weight further.

The problem with the latter option was that if I then removed too much material, the third prototype might fail prematurely before proof load was achieved. I would then have to add back weight and make a fourth prototype. Given that the part had already met my weight goals, and that further optimization was likely to only shave a few tenths of an ounce off of the final design, I decided to call the part good. There is usually a law of diminishing returns with destructive parts testing.
Eliminating Weak Links
Another way that testing components can improve design is to reveal “weak link” components in the system. All else being equal, it’s theoretically optimal to have all parts of a system fail simultaneously when ultimate load is exceeded. (There is the famous dictum in F1 racing, variously attributed to Ferdinand Porsche, Colin Chapman and others, that “the perfect race car crosses the finish line in first place, then falls to pieces.”) That said, we like a bit more safety factor in our planes!
Nevertheless, it does not make sense to size a rudder cable for a load factor of ten if the bolt attaching the cable to the rudder will shear at a load factor of six, and the rudder itself is designed for a load factor of four. It makes sense to think about where you want the weak links in the chain; some failure modes are more desirable than others.

A Graph Is Nice!
As previously mentioned, there’s no reason most of these tests couldn’t be performed with a hydraulic tool and some kind of jig or frame. That said, I do like that Thor gives me a force versus deformation graph at the end of each test. These graphs often show the onset of failure before total failure occurs, or they show the part is capable of maintaining some kind of residual load even after failure, which is an important aspect of some failure modes.
In one series of tests I was investigating using aluminum honeycomb as a shock absorber under the pilot’s seat in the event of a crash. The graph showing area under load versus displacement represented the energy absorbed by the shock absorber, so maximizing this area was ideal. After putting an initial load on a product called CrushLite to initiate crumpling, the subsequent load-displacement curve showed the ideal shock absorption. (You can see a neat video of this). I was able to use Thor to replicate this with a sample of CrushLite and to also test some other materials for their shock absorption capability. This would admittedly have been a bit difficult to do with a hand-operated hydraulic setup.

A final note: as I’ve mentioned in the previous articles, remember that destructive tests can release a lot of energy. Below are a couple of pictures showing the blast shield that I put on the UTM before conducting tests. Even with the shield in place, I still wear protective eye gear—you never know if something might ricochet outside the test area. I’ve had chunks of test pieces end up on the other side of the shop. Err on the side of caution.
That wraps up this series on testing. If you have test rigs and parts that you’ve broken on them, please send some photos and a short write-up, and we’ll try to include them in a future article.


Hi:
A fascinating series covering a very interesting subject, written in a manner n0n-scientists can understand!
Also, I found this on honeycomb energy adsorption from Hexcel:
“HexWeb Honeycomb Energy Absorption Systems Design Data”
while looking for under-seat crush solutions. F1 has been using honeycomb for awhile for this.
Thanks, again!
Regards,
James
Comments are closed.