 As we found in the EFIS buyer’s guide article in the May 2020 issue, big-screen EFIS models usually have engine and fuel-data interfaces. It’s an expected standard and an easy sell to builders creating panels from scratch. Modern graphics, landing gear and flap interface, fuel quantity and flow, plus automation for precise engine leaning and best economy settings are on the short list of capabilities.
![]()
It’s a different story for owners of older, flying homebuilts. Changing from steam gauges to full glass will usually require substantial panel work and, inevitably, more downtime and expense. As an alternative, perhaps even as an interim upgrade, there are standalone engine displays—that’s what we’re going to explore here. Spec’ing the right one is both simple and challenging. Good ones have straightforward display logic, audio outputs for audio panel interfacing, and they should come with high-quality probes and sensors. There should also be reliable technical support for both installation and hardware repair/upgrade. In this article, we’ll outline our top-pick standalone engine monitors. We can’t come close to covering every part of their feature sets, so we’ll summarize features that stand out.
Electronics International
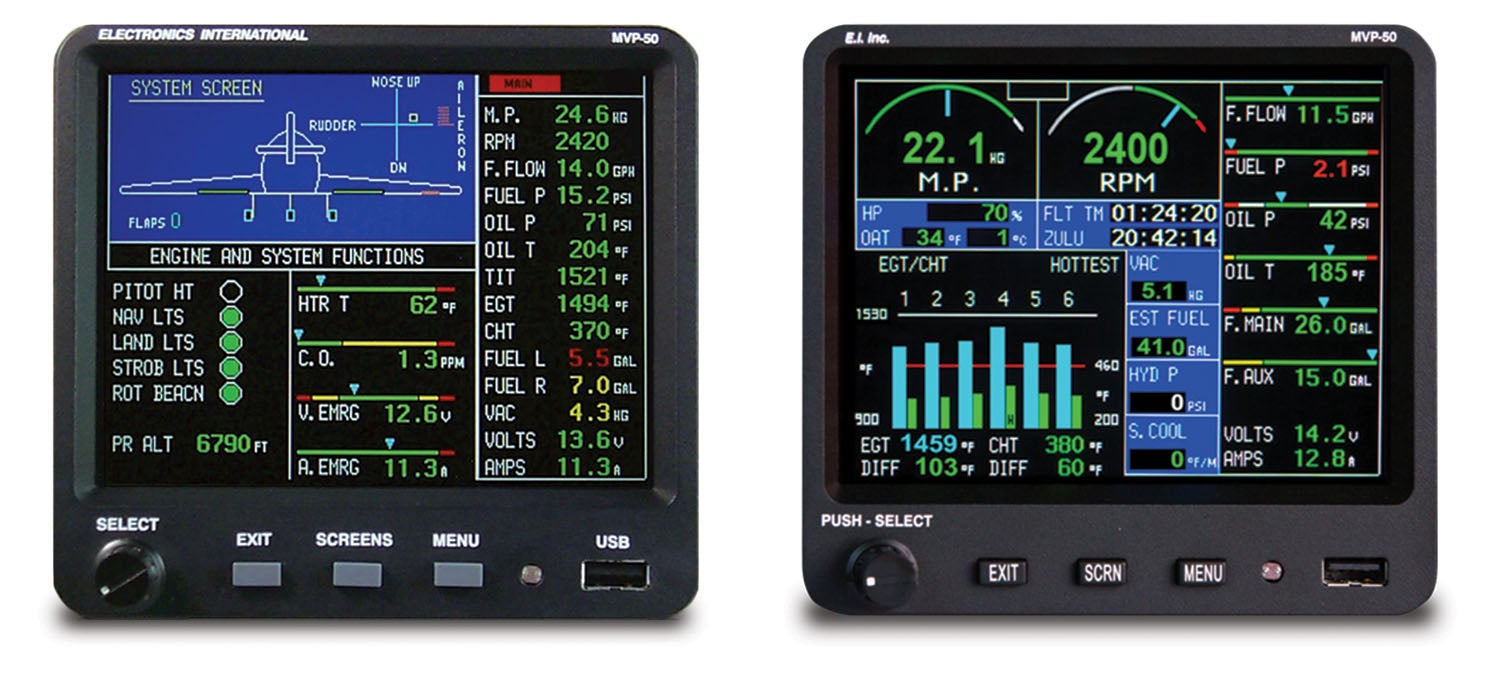
The company makes a variety of standalone instruments that have TSO certification, but Electronics International says there are two specific models that are the most popular for Experimentals. One is the non-certified version of the big-screen MVP-50P, which retails for $5480 for four-cylinder engines and $5980 for six-cylinder engines. That’s $1000 less than the certified versions.
As standalone monitors go, the MVP-50P is big—5.6 inches wide, 5.2 inches high and 2.4 inches deep—and mounts from behind the instrument panel, which means the TFT color screen sits flush. There are multiple components including MVP display, engine data converter (EDC-33P), the engine probes, transducers and modules, and the wiring and extension cables. The EDC is a smart box, converting raw probe and sensor inputs to serial data, which is then provided to the MVP-50P via two-wire RS-422.
The instrument isn’t touchscreen, but the feature set is navigated with a rotary Select knob and three keys at the bottom of the bezel, and operation is logical. The Select knob can be rotated or pressed and, depending on the screen and field being viewed, rotating the knob can move an arrow, select a digit or change a digit’s value. Pressing the Select knob will choose the highlighted item. The control set is logical, but we would like a touch (or at least a hybrid) interface.
As for features, this MVP-50P is more than an engine monitor. Think of it as a system monitor, and huge amounts of data are spread out on multiple pages. The main engine screen displays most of the engine and also flight instruments monitored by the MVP. This is the default power-up screen and what you’ll use for most of the flight. The secondary is the System screen, intended to display functions that do not need to be displayed continuously.
However, if any function on the System screen reaches a red or yellow operating range, it triggers an annunciator (located between the rpm and MP displays on the main engine screen). There’s also an external annunciator panel for heads-up warning. Think of it as master caution alerting.
The best part of the System page is a pictorial that can offer at-a-glance clues to system malfunctions on the airframe. For example, you can see the position of landing gear and wing flaps, plus the state of exterior lighting. There’s numerical display of critical flight instruments, including airspeed, in a horizontal strip format with appropriate color coding. The right side of the display shows up to 14 engine parameters. It’s a lot of data.
The Main Engine Screen is laid out in four areas. There’s rpm and manifold pressure, which are located at the top left of the screen and each has a large arc and digital display. There are also horizontal strip and digital gauges, plus four additional digital instruments can be configured on the right side of the screen. These include items like oil and fuel pressure, fuel flow and electrical data. The Engine Analyzer is located on the lower left portion of the Main Engine Screen, which monitors both EGT and CHT. This has both bar graph and digital formats and has features for leaning, plus an engine diagnostic utility. Logically, the Select knob controls the display and operation of the engine analyzer portion of the screen.
There are also four digital support instruments on a blue background, located in the middle of the display. The four vertical instruments may be configured to display various functions in a digital format or as an annunciator, such as Canopy, Baggage Door, Landing Lights, Rotating Beacon, etc. There’s even a timer feature.
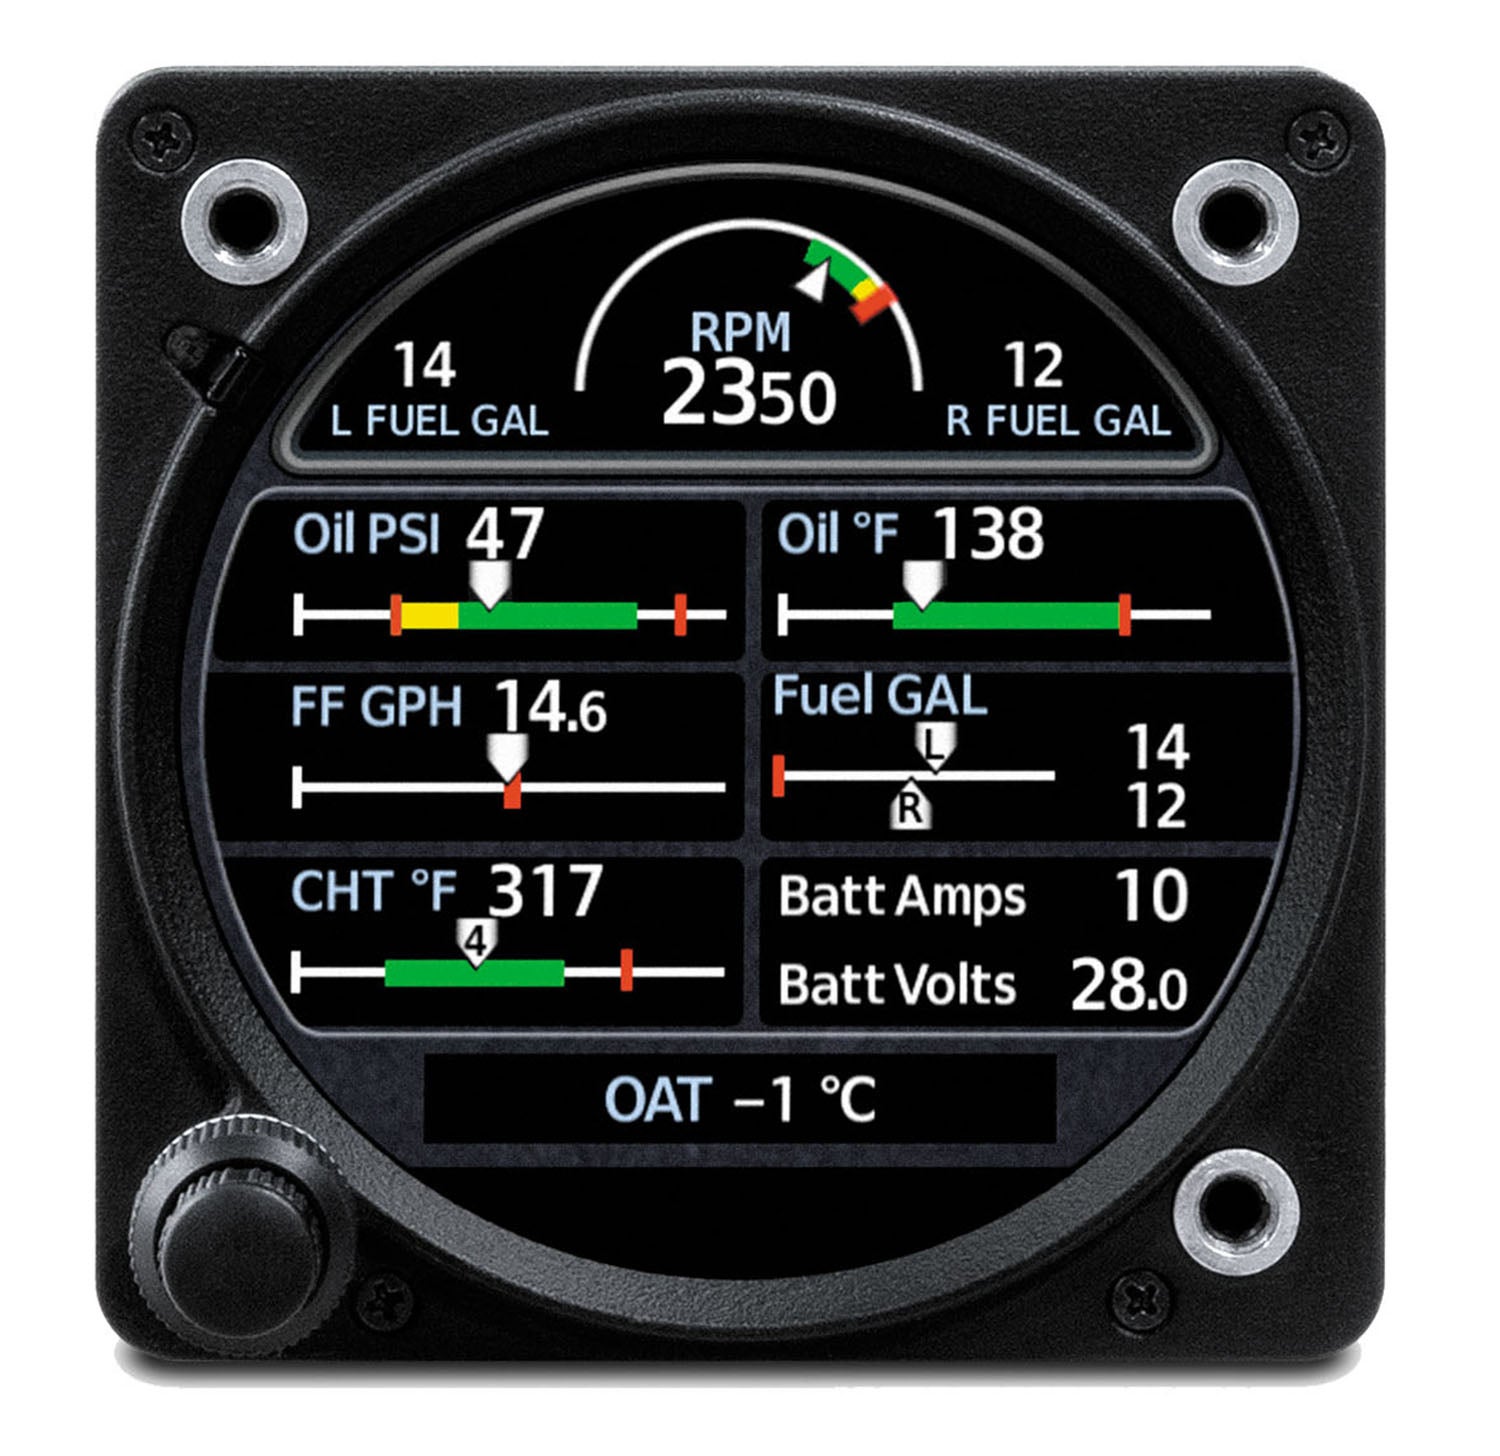
EI CGR-30P
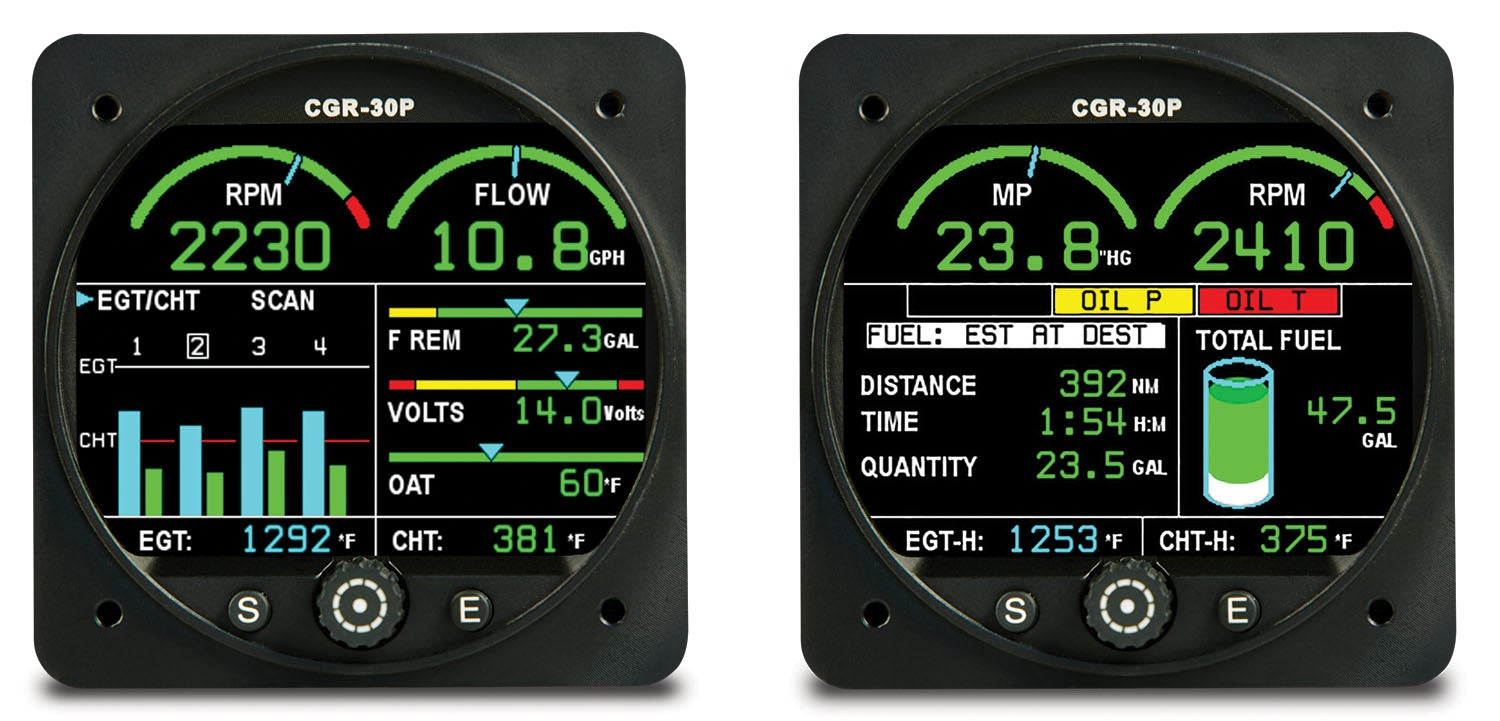
This Electronics International full-up color engine monitor fits in a 3-1/8-inch instrument cutout. The four-cylinder version is $4417 and the six-cylinder is $4914 and comes standard to display rpm, EGT/CHT bar graph, fuel remaining, tach time, local time, fuel used, GPS/fuel flow data, external caution and warning, and data recording. You can also choose five additional parameters from the list of manifold pressure, oil pressure, oil temperature, fuel flow, fuel pressure, fuel level (left and right tank), aux fuel level, TIT, carbon monoxide detector (a $495 option), vacuum and volts.
The CGR has only three user controls for simplicity. The “E” key backs out of a screen and ultimately takes you back to the primary screen, the “S” key advances through each screen, and the center menu select knob is used for editing and configuring data. We think EI did a good job of keeping workload at a minimum (particularly when deciphering problems), thanks to a straightforward feature set. We also think the data is presented in a logical manner and despite the compact screen, the data doesn’t seem overly crowded.
The main page of the CGR displays engine manifold pressure and rpm presented side-by-side in both a numerical and graphical presentation, plus four other configurable primary functions. EI told us most users select fuel flow as one of the other primary parameters. From there, you can add oil temperature, oil pressure and bus voltage, for example. These functions are approved for replacing primary instruments. For engines that don’t have a manifold pressure gauge, the data field can be customized to display fuel flow, for example.
The lower half of the main page displays EGT and CHT in the familiar bar graph presentation. The CGR borrows some logic from the big-screen MVP-50P monitor—showing engine parameters via digital tape sliders or graphically. There’s a normalized mode for general health monitoring, a lean mode for operating rich or lean of peak, plus an EGT and CHT graphical display. This is a bird’s-eye digital pictorial of the engine with proper orientation of each EGT and CHT channel and includes the temperature of each. Pretty trick—and useful.
Think of the secondary screen as an overflow for displaying additional data (the secondary display still shows rpm and manifold pressure). For example, the fourth primary engine parameter is displayed on this page, in addition to five non-primary instruments. You can select bus voltage, outside air temperature, flight timer and so on. This is also where caution warnings are displayed, should any function on the main screen become flagged.
The CGR has a fuel totalizer with GPS interface, of course, plus it can be ordered in a configuration to monitor the fuel quantity level for up to four fuel tanks, including auxiliary tanks. Moreover, the unit is smart enough to know which fuel tank you are drawing from and can estimate how much fuel is remaining in each. An on-screen graphic depicts the total fuel remaining in all tanks. We like the simple and thorough approach the CGR takes when monitoring fuel endurance. For example, on the fuel page you can scroll through fuel flow plus estimated distance/range based on the active flight plan or waypoint that’s in the connected GPS.
The CGR annunciates a wide variety of alerts from external systems. Any temperature or resistive fuel level input channel on the EDC may be used to monitor the state of a switch, relay or output from a remote device. This output can be used to trigger an on-screen annunciator on the CGR display. This includes warning lights for a canopy latch, baggage door, pitot heat or other systems you want to monitor on the CGR’s main or system screen. The CO Guardian remote-mounted CO detector, to name one third-party device, can be displayed on the screen.
Like the MVP-50P, the CGR can interface with the Electronics International AV-17 voice annunciation system. This remote system provides up to 17 verbal warnings through the headphones via the aircraft’s audio panel or compatible intercom.
EI UBG-16
For more basic all-in-one monitoring, Electronics International still offers the bar-graph style UBG-16, which fits in a 2-1/4-inch instrument cutout. It has minimal user controls to cycle among three major displays modes: Normal, Normalized and Lean. Each time the Mode switch (bottom left of the bezel) is pressed to the right, the UBG will advance to the next operating mode and the top of the display indicates which mode the UBG is operating (except when it’s in Normal mode, as this is the main page).
In the Normal mode, the EGTs are indicated by the height of the lit bars in each of the columns. The CHTs are indicated by the height of the blanked bars (33° per-bar scaling) in each of the columns, and a CHT of 300° F will cause the second bar from the bottom to blank. It’s an intuitive presentation for at-a-glance monitoring. The scaling and range of the EGT columns of bars may be customized.
The feature set is logical. When operating in the Normal or Normalized Operating Mode, each time the Step switch (bottom right of the bezel) is pushed to the right the UBG will advance the digital display to show the next temperature or function. Each time the Step switch is pushed to the left the display will show the previous temperature or function. The EGTs and CHTs are always shown in the display, beginning with the Number 1 cylinder. EGTs are on the left and CHTs the right. The lighted box around a specific cylinder number (located at the top of the columns) coincides with which cylinder is being displayed. Each time the Step switch is pushed to the right the next cylinder will be displayed.
There are a total of 16 input channels on the UBG. The columns of bars can display EGT, CHT, TIT or Oil. Other functions will be indicated only in the digital display. While viewing the digital readout for the last column of bars, you push the Step switch to the right to display the next temperature or function connected to the UBG’s input channels. It’s pretty logical.
When you enter the Lean Operating Mode of the UBG, the right portion of the digital display will show the current EGT for the cylinder that peaked first the last time you leaned your engine. The word “LEAN” will be displayed in the left portion of the digital display.
We’re particularly fond of the shock cooling feature. While the last monitored temperature or function is being displayed, you push the Step switch once to the right to see the shock cooling rate in the display. This is the rate (in °F per minute) at which the indicated cylinder head temperature is cooling. The cylinder number inside the lit box at the top of the columns is the programmed shock cooling cylinder being displayed.
The UBG offers up to 16 High and 16 Low alarms (one high and one low alarm for each input channel), one EGT differential alarm and one shock cooling alarm. The UBG performs a full analysis on all temperatures and functions every one-half second. The 34 pilot-programmable limits allow you to customize the UBG to your engine. Trend analysis and problem detection is done automatically every one-half second, and you are alerted as soon as a limit is violated.
Insight GEM
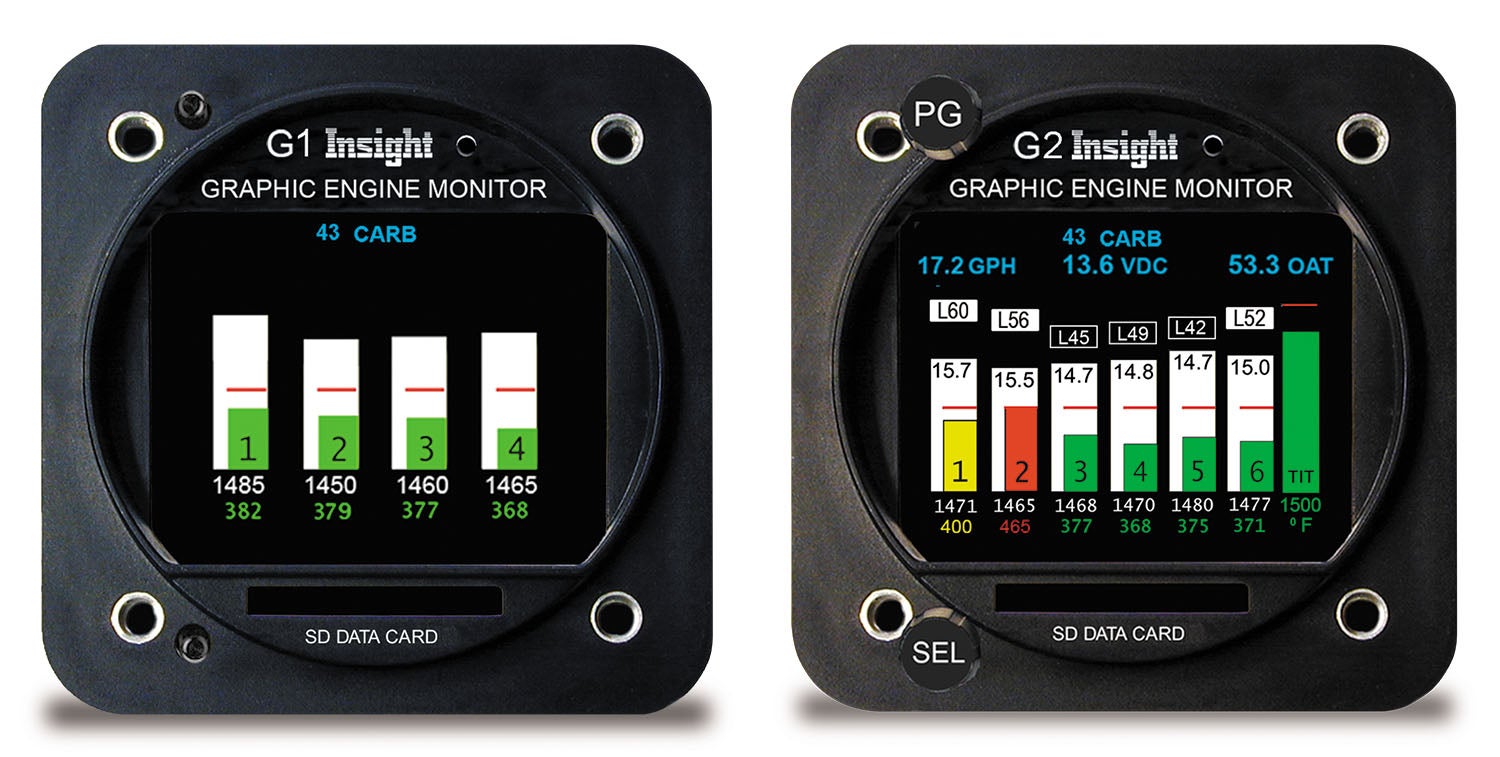
Canadian-based Insight Avionics has sizable market traction with the color GEM G-series monitors. The current entry-level color monitor is the 2-1/4-inch G1, which doesn’t have a fuel flow computer. This means you won’t have the advanced leaning functions that are standard with other models. The G1 doesn’t come with rpm, OAT, manifold pressure, rpm or oil temperature functions. It does have EGT, CHT, TIT and carb temperature capability. Think basic temperature monitoring.
As with all of the G-series monitors, the instrument has a high-resolution color LCD, while the user controls are limited to two buttons at the top and bottom of the instrument’s bezel. The top button controls screen selection, while the bottom button controls items within the given screen. Each screen assigns its own functional needs to the controls that may change, depending on context.
The basic G1 has three primary screens. This includes the EGT/CHT bar graphs (each cylinder has its own display column displaying both CHT and EGT simultaneously), a basic engine leaning screen and an EGT/CHT sensor probe diagnostic screen. With probe diagnostics, there’s no more guessing if an unusual parameter is related to a faulty sensor or a real problem since this diagnostic screen displays the measured health of each temperature probe.
On the main page, all monitored temperatures are continuously displayed in both a color-coded bar graph and in numeric form at the bottom of each bar. A CHT redline appears on each bar, while the CHT graphic bar turns yellow at 410°F and red at 460°. For turbocharged applications, the green TIT bar turns yellow at 1600° and red at 1650°, while a TIT redline is displayed above the TIT bar. In carbureted applications, the carb temperature function (it’s an option on the G1 and standard on the rest) is displayed in the center of the display.
The model G2 has all of the G1 functionality, plus an integrated fuel totalizer. If you have an existing Shadin or JP Instruments fuel computer, Insight offers a fuel flow signal adapter so you can use the existing fuel flow transducer, saving considerable installation effort. The G3 adds rpm, MP, OAT, air data input and hard landing dynamic analysis.
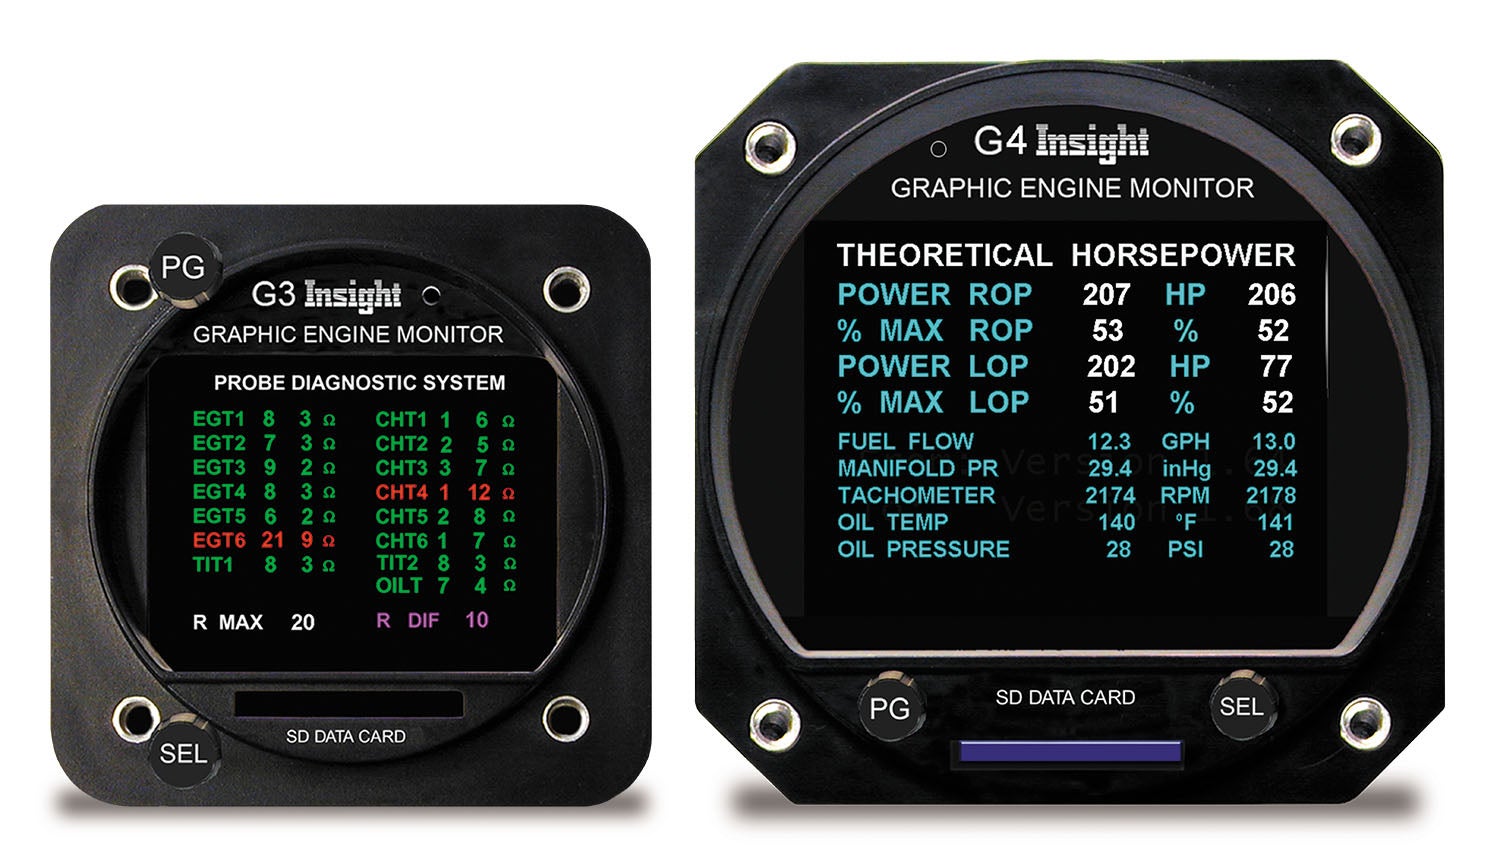
Perhaps a favorite GEM feature (available on the G3 and G4 (twin) models only) is the vibration analysis utility for spotting mechanical component failure early. Since not every engine will have the same vibration signatures, Insight recommends using the utility as a condition monitoring tool. The sensing is done with a three-axis accelerometer installed on the engine case bolt, in proximity to the propeller. Once the sensor is connected (it can be added to any G3 and G4), the instrument displays a dedicated vibration spectrum page with a waveform display. After using the utility for a while, Insight said users will recognize what is normal vibration and what isn’t. The trick is spotting new spikes, or recognizing that an existing vibration signature is worsening, evident by its growing in magnitude/wavelength.
The utility has a total of six sub-screens for each of the remote accelerometer’s axis measurements. You can zoom in on the displayed waveform for closer examination, while a cursor automatically snaps to nearby vibration spikes in case you miss them. Since the data is saved to the instrument’s SD data card (in hexadecimal bytes in the log file) by pressing and holding the top bezel button, you can load the data to a computer where it opens in Microsoft Excel.
The basic G1 starts at $1485, the G2 is $2093 for four-cylinder engines ($2275 for six-cylinder) and the G3 is $3185 ($3367 for six-cylinders). There’s also a G4 ($3998 for a four-cylinder single), which has a 3-1/8-inch bezel and larger display. Standard install kits include spring-style probes.
JP Instruments
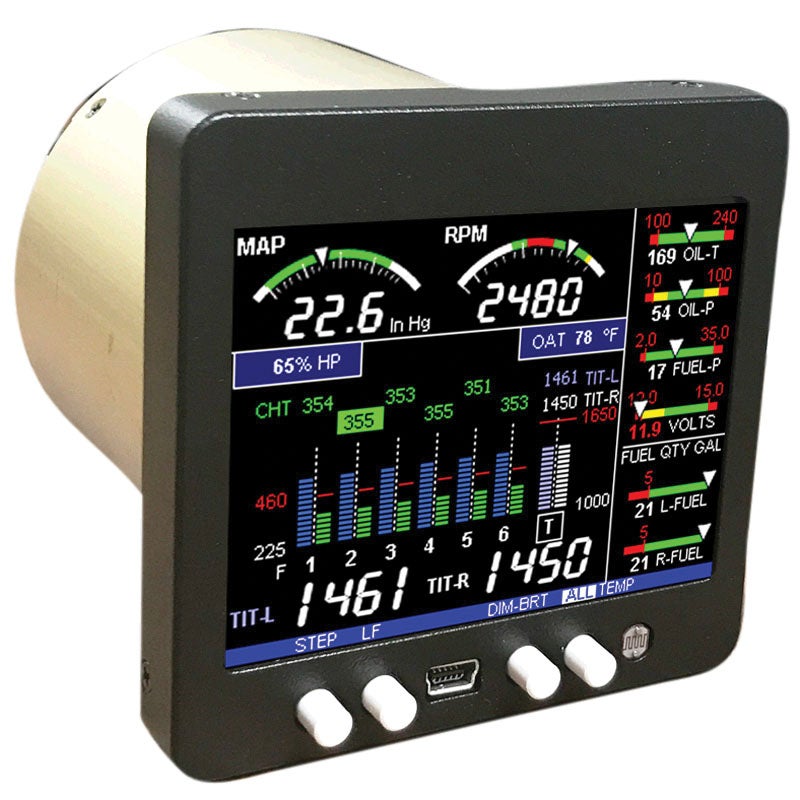
Aimed at the Experimental market, the EDM-350 is a no-nonsense color monitor that fits a standard 3-1/8-inch instrument cutout and has a 3.5-inch square bezel. You can order it basic or what JPI calls a full-featured model with a P5 connector that handles fuel quantity, fuel pressure and amps options. The base-model EDM-350 has EGT/CHT only and is priced at $1200 for four-cylinder engines and $1450 for six-cylinder installations. Simply add plug-and-play options, including rpm, MP and oil pressure ($299 for each), plus other options like the FloScan fuel flow transducer ($595 for carbureted and $490 for fuel-injected engines). There’s also a $95 remote warning annunciator.
EDM-350 to suit your needs.
The feature and control set of the EDM-350 trickles down from the TSO-certified EDM-730. You can orient the display for a landscape or portrait view, and a simple bar graph and numeric readout for EGT and CHT is in the main area of the screen. When optioned, rpm and MP are at the top. Along the side are linear gauges, which are both digital and analog indications for various parameters. The sliding pointer and color range marks give you a quick indication of where you are relative to the operating limits while the digital value provides precise information.
We think the data is reasonably easy to digest at a glance, and there’s the expected scanning mode that keeps tabs on all the monitored parameters. It’s a default setting and automatic scanning begins a few minutes after power up without any user interaction.
There are three operating modes: Automatic, which is accessed by tapping the LF button and then Step, sets the unit so each cylinder and parameter value is automatically sequenced and shown on the display for a few seconds. Freeze it by pressing the Step button to cycle into manual mode, and then index to the next parameters by subsequent presses of Step. Ready to lean? Go to LeanFind by tapping the LF button, start pulling the mixture and the EDM assists in finding the correct cylinder to peak. Holding both the STEP and LF buttons simultaneously for several seconds after entering LeanFind mode, but before beginning to lean, will toggle between leaning rich of peak (ROP) and lean of peak (LOP).
What JPI refers to as a cylinder “barograph set” is a dotted line leading from the cylinder’s number vertically to its EGT/CHT digital values. An ID box around cylinder’s number indicates which one is being displayed numerically, and digital temp value of all are shown at the top of the display. The EGT column is located to the left of the line and the CHT column to the right. Columns are composed of a stack of segments and the maximum height for a column is the top of the dotted line. The CHT redline value is depicted by a horizontal red line approximately halfway up and to the right of the dotted line. The EGT column has three different viewing modes: Percent View, Normalize View and Lean Find.
In Percent view, when the EGT normalize indicator “NRM” is not lit, the columns indicate percent of EGT redline. Each column is composed of a stack of segments, and a maximum height column (all segments lit) depicts 100% or more of redline. A one-segment-high column depicts 50% of the redline. Simply put, if the redline is 1650°, a maximum height column represents 1650°, while a one-segment-high column represents half that value, or 825°. The Percentage view lets you view EGTs across all cylinders and quite logically, hotter cylinders display higher columns than cooler cylinders.
For ground runup and level cruise flight, there’s the Normalize view, where all column peaks are set to the same half-height level for trend analysis. Any changes are shown as an increase or decrease in the column height. For instance, a one-segment change in column height represents a 10° change. You use the Normalize view for a rapid visualization of EGT trends, rather than a percentage of redline as you would in Percent view. To toggle between these two modes, hold the LF bezel button until the NRM indicator goes on or off.
Worth mentioning is the built-in diagnostic mode, which helps find sensor issues when the system boots. Any newly installed options are found and logged in at this time. If a probe problem is found, diagnostic indications will be presented on the display. These vary depending on the parameter. For CHT, EGT and TIT, a message appears in the scanner info area. For example, if the second cylinder’s EGT probe was open, the unit flags an OPEN EGT 2 message. For an inoperative horizontal linear gauge function, a red “X” is drawn through it and its digital value is dashed out. The unit will ignore any faulty probe when in scanning mode, and the unit periodically checks for inconsistent or intermittent signals. These are disabled if deemed unusable, flagging an appropriate message.
The EDM compresses and records all displayed parameters once every six seconds in long-term data memory.(Note: you can change this rate to be 2 to 500 seconds.) This data is retrievable by inserting a USB drive into the jack on the front of the instrument and following the prompts. You can choose to retrieve all the data stored in the EDM or only the new data recorded since your last retrieval. In either case, the selected data in the EDM is not erased. The data can later be viewed on EzTrends, a PC program available from JPI or over the internet. The EDM contains a real-time clock that may be set when you initially program your instrument. You may also program an Aircraft ID that will appear in the output data file. You can change the recording interval from 2 to 500 seconds, even in flight.
When equipped with a fuel flow transducer, you’ll see accurate flow data, and like most any fuel totalizer, prior to starting the engine you tell the unit the known quantity of fuel on board and it subsequently tracks all fuel delivered to the engine. You can set fuel alarm limits, there’s a GPS interface via RS-232 for endurance calculations, and the unit also transmits the data back to the GPS. No excuses for running the tanks dry, especially with the fuel quantity feature.
The EDM interfaces directly with the aircraft’s fuel tank senders and can process signals from three types of sender signals: resistive output, voltage output or frequency output. JPI provides the appropriate interface hardware (the P5 harness and any associated signal conditioners) based on information you provide when you order the unit. Once installation is completed, you will perform a one-time fuel level calibration. As with any retrofit that includes fuel quantity, the accuracy will be as good as the senders. If they’re aged, consider having them calibrated and in many cases rebuilt. We’ll look at fuel sender upkeep and upgrades in a separate article.
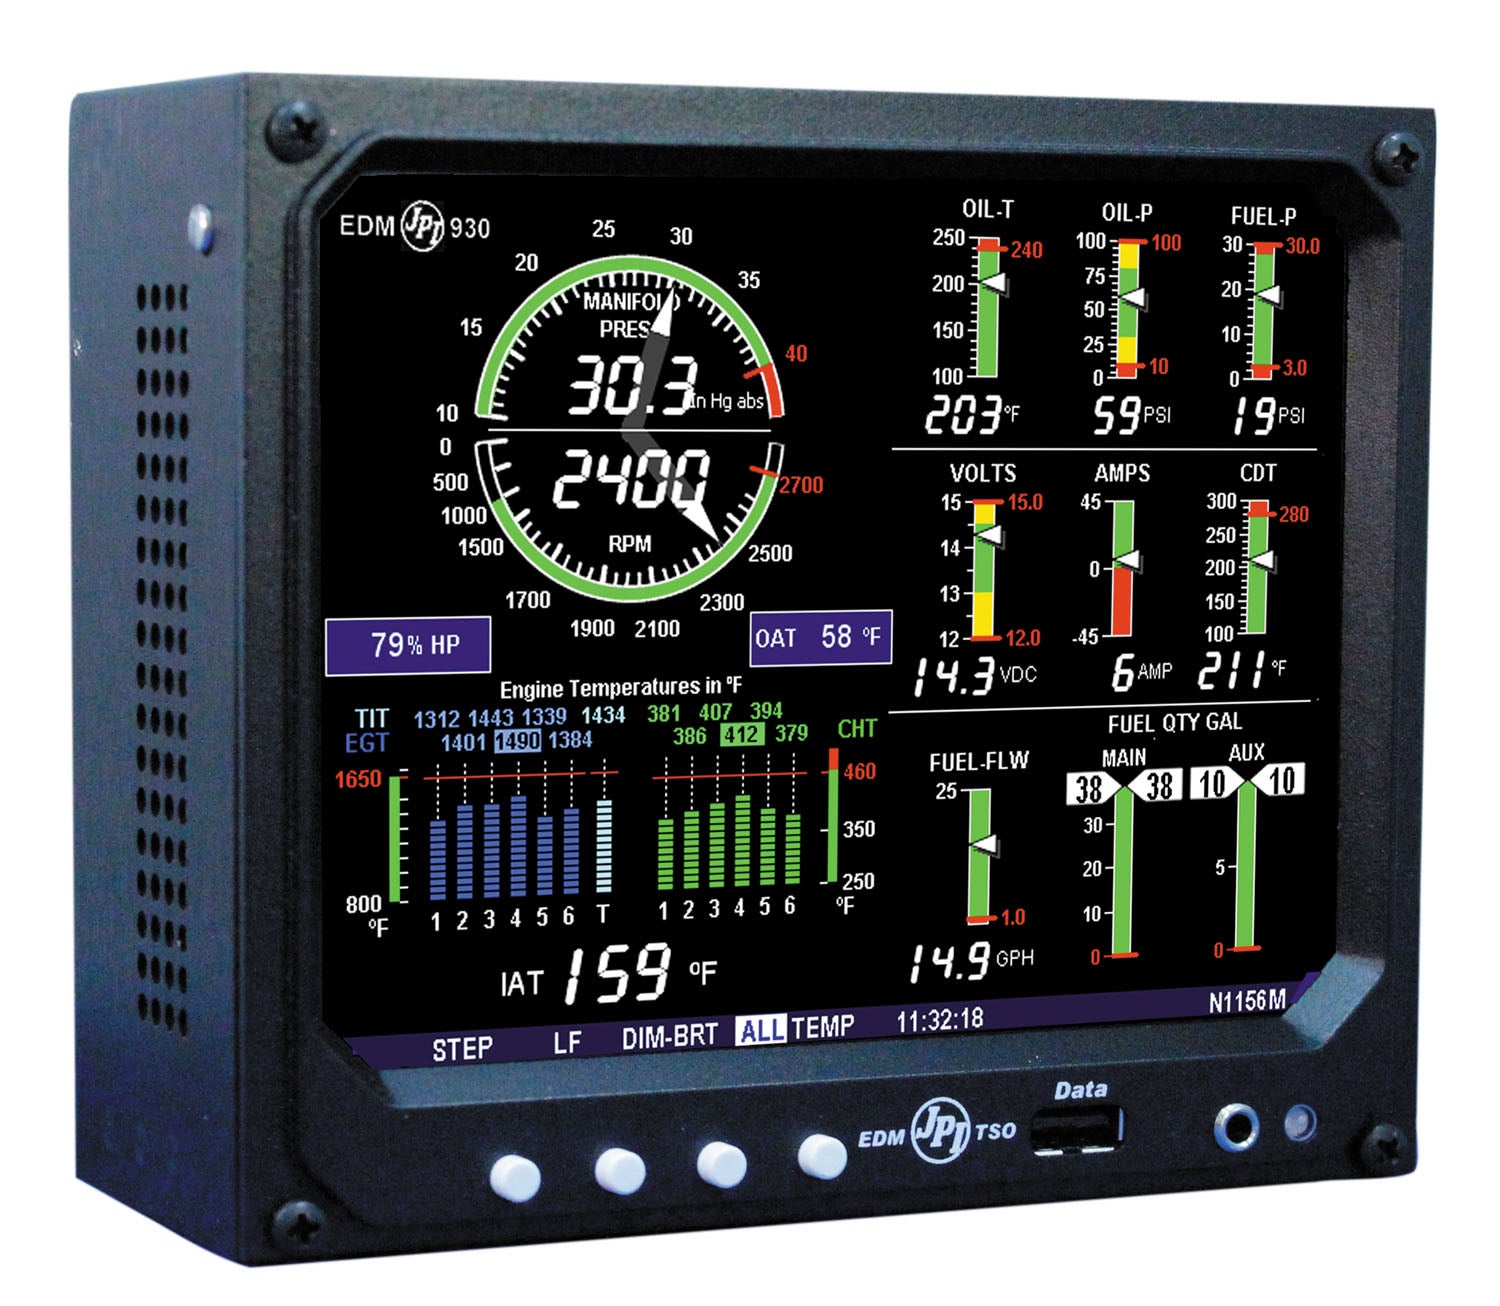
There’s also the EDM-930 Experimental—a big-screen version with a whopping $6100 price tag ($6700 with fuel quantity capability). It mounts in a 3-1/8-inch hole or it can be flush mounted and has a TFT, full VGA display. It comes with a prewired harness for all functions.
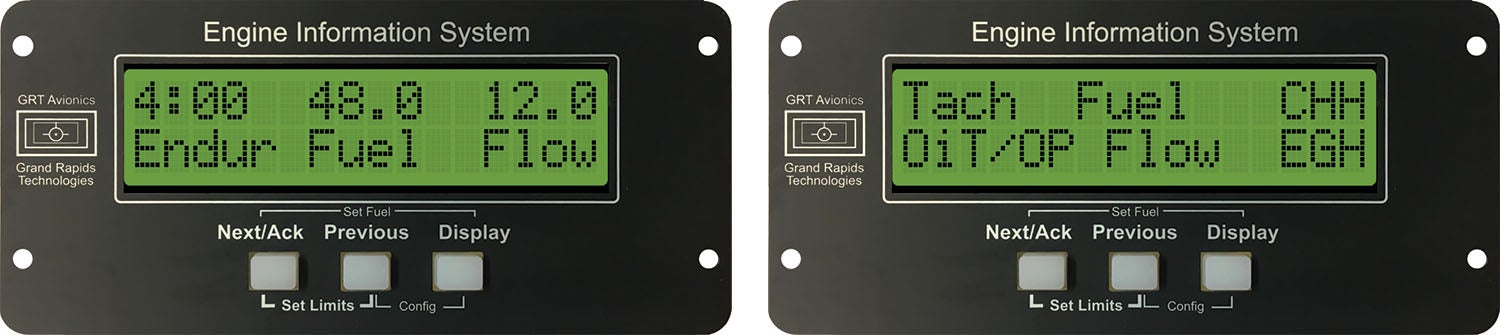
Grand Rapids EIS
This monitor has been around since the 1990s and its 32-character LCD display is stark by comparison to the others. But that’s not necessarily a bad thing. Think utilitarian, perhaps even as an interim solution while you postpone a GRT EFIS upgrade, and connect the two over a single-wire data connection when you do. The fact that there are over 23,000 of these in the field is impressive, and we think it has sizable flexibility and—most important—is well supported.
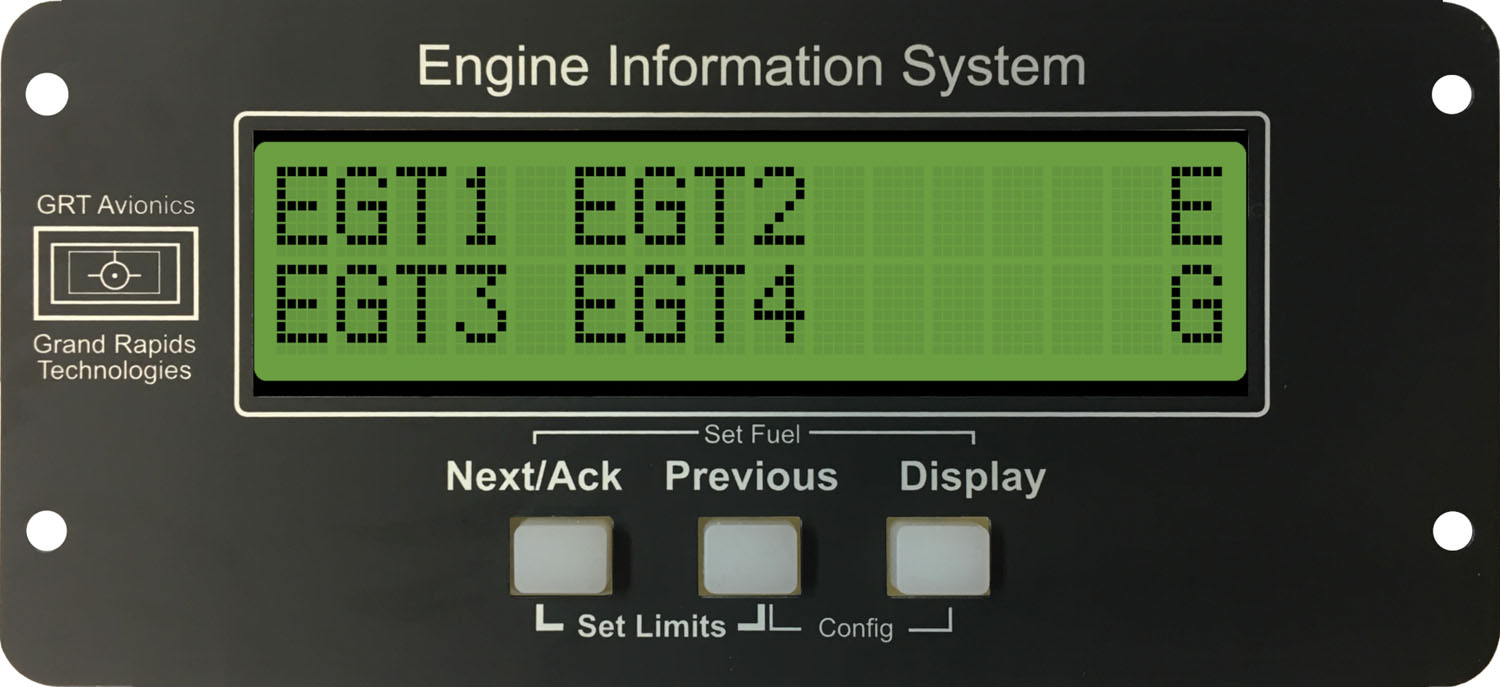
The line includes the model 2000, 4000, 6000 and 9000 EIS (nomenclature corresponding to the number of cylinders) and each has five pages of scrollable data on a rectangular control head, which measures 5.9 inches wide, 2.8 inches tall and roughly 3.0 inches deep with electrical connector. The system has both engine data storage and download capability. GRT told us while the model 2000—priced at $410 without probes and common for two-stroke Rotax models—is aimed at two-stroke engines, it can also be used on four-cylinder engines. Maybe you only want to monitor the two hottest cylinders. It won’t accommodate carb temp, oil pressure or oil temperature inputs and doesn’t have the comprehensive leaning utility.
More common is the EIS 4000, even for a Rotax, because it accommodates more user-configurable auxiliary inputs—up to six. These accept up to 5 volts of input voltage and can include fuel pressure, fuel level, manifold pressure, coolant pressure and voltage/current monitoring. Turbocharged engines (for TIT monitoring) use two of the aux inputs. The standard feature set includes upper and lower limit alarm outputs (for driving an external sonalert), a flight timer, hour meter, voltmeter, OAT and landing gear minder, which uses airspeed and tachometer inputs.
The EIS can work well even as a standalone fuel computer when connecting a flow transducer, and it has enough utility to help spot problems in fuel system plumbing. For example, the maximum fuel flow warning is triggered when the flow exceeds your programmed limit—maybe pointing to leaking fuel lines and loose connections at the fuel injectors. There’s also minimum cruise oil pressure warning for quickly spotting low oil pressure at preset rpm range. As basic as the cylinder monitoring is, we think the EIS could make for a decent warning system.
The basic M4000 package for a four-cylinder Lycoming is $1210 and includes wiring harnesses, bayonet-style CHT probes and adapters, EGT probes, oil pressure sensor and oil temp sensor. For $1758 you get fuel flow and fuel pressure sensors, plus manifold pressure.
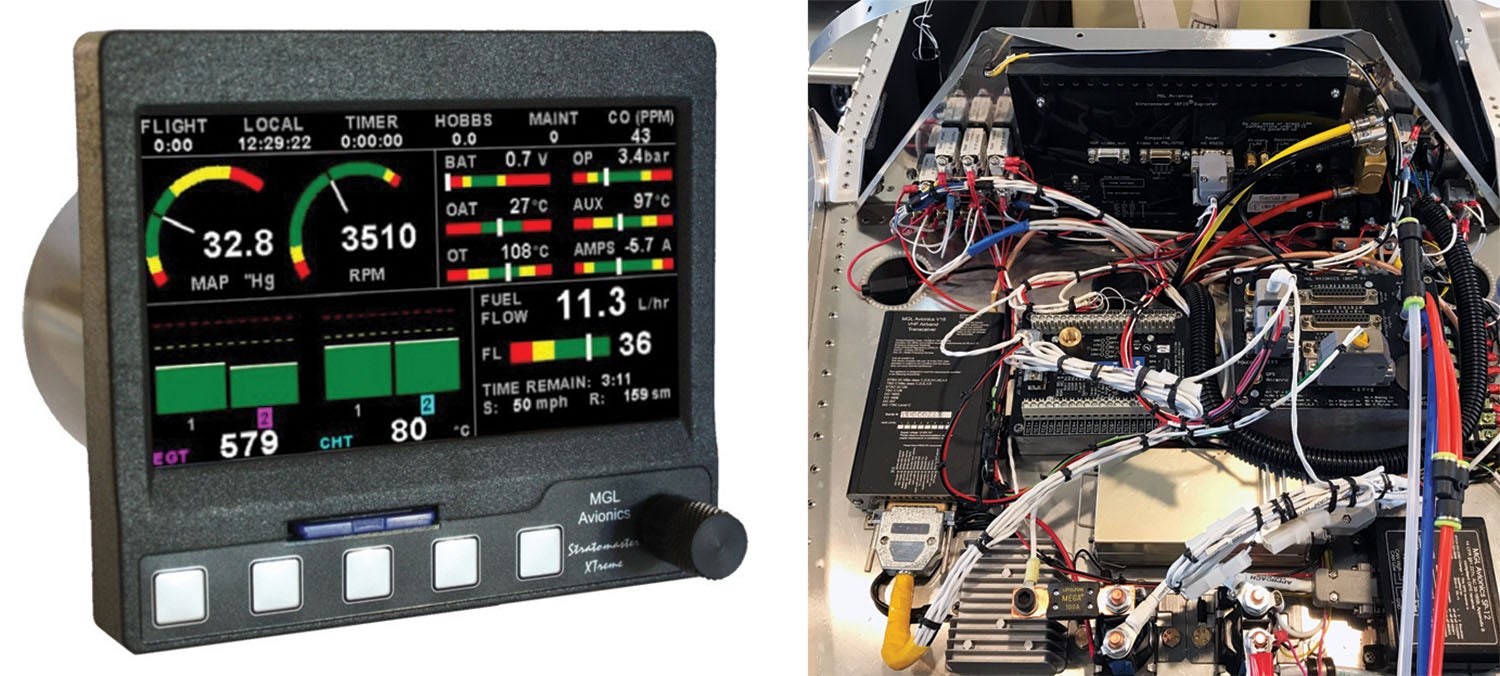
MGL Avionics
The MGL Xtreme EMS fits a 3-1/8-inch instrument cutout, has a 4.3-inch high-res color TFT LCD display and works with a wide variety of engines. It uses an SD card for data recording, storing checklists and for customized splash screens. The interface potential includes a CAN port, one RS-232 com port and two proprietary MGL com ports used for airspeed input. There’s a single D15 input connector on the rear chassis, and the system has provisions for GPS input for fuel endurance calculations. It also accommodates fuel flow, fuel level input and 12 thermocouple probes for EGTs/CHTs.
The control set is focused around a rotary control knob and five bezel buttons, and the left- and right-most soft keys are used to cycle through the EMS pages. There’s a dedicated menu for adjusting the display backlighting on the fly and it’s controlled with the rotary knob. The main menu page with various icons (for setup, flight timers, flight log and other utilities) is accessed with a push of the control knob and cursoring to the Menu icon. The system pages are logically laid out and the main data is easy to interpret in part thanks to good screen quality and block-style font. A configurable information bar is at the top of the EMS display, while all primary data is nicely placed in the middle with configurable data blocks, starting with MP and rpm on the left, oil, voltage, OAT and other inputs to the right. Below that is the EGT and CHT graphic data block and fuel data to the right. You can monitor an external CO detector from CO Guardian.
As expected the system has a lean-assist mode for easily determining the peak EGT. The Lean Mode indicator is at the lower right corner of the display, and the absolute EGT temperatures will change to show the EGT reading relative to this peak. The sequential order as each cylinder peaks is also shown as numeric text under the cylinder. The first cylinder to peak is identified with a “1” under the cylinders bar graph, for example, and that EGT’s temp while leaning is shown in the upper portion of the data block. Exit lean mode and enter normal mode by pressing the Off soft key. Once Cruise Mode has been enabled, the Cruise Mode label is displayed at the bottom of the EMS display to clearly differentiate it from the normal operating mode. Once out, all EGT and CHT readings are immediately sampled as reference temperatures for cruise. The display then shows EGT and CHT values relative to this reference temperature. Cruise mode can be canceled by pressing the soft key to Off.
There’s also a GPS status page when an external receiver is connected. It shows GPS-derived altitude, ground speed, Zulu time and date and lat/long data. Want to customize the splash page for your application? You can load a bitmap picture in 480×272-pixel resolution, and MGL offers an Enigma BMP to MIF converter tool on its web page. There’s also Checklists, which is a word processing program saved and loaded with a .ECL extension where it’s then stored on the bezel-loaded SD card.
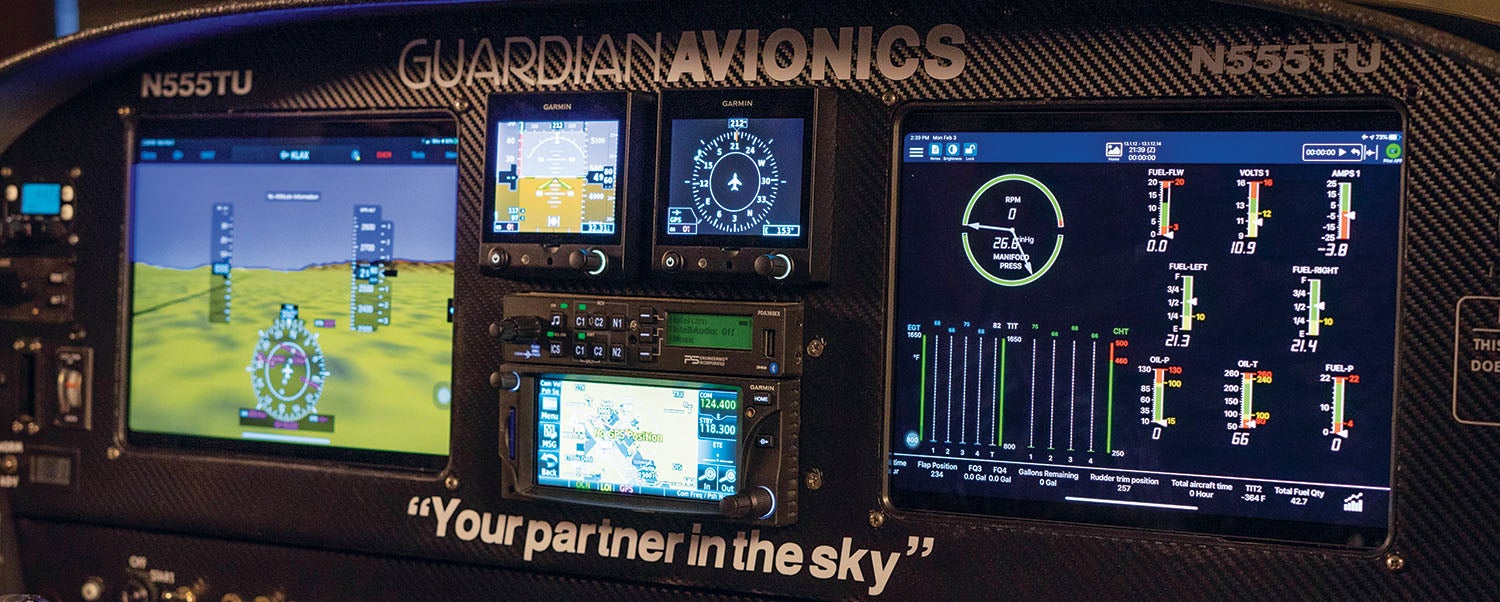
Guardian Avionics
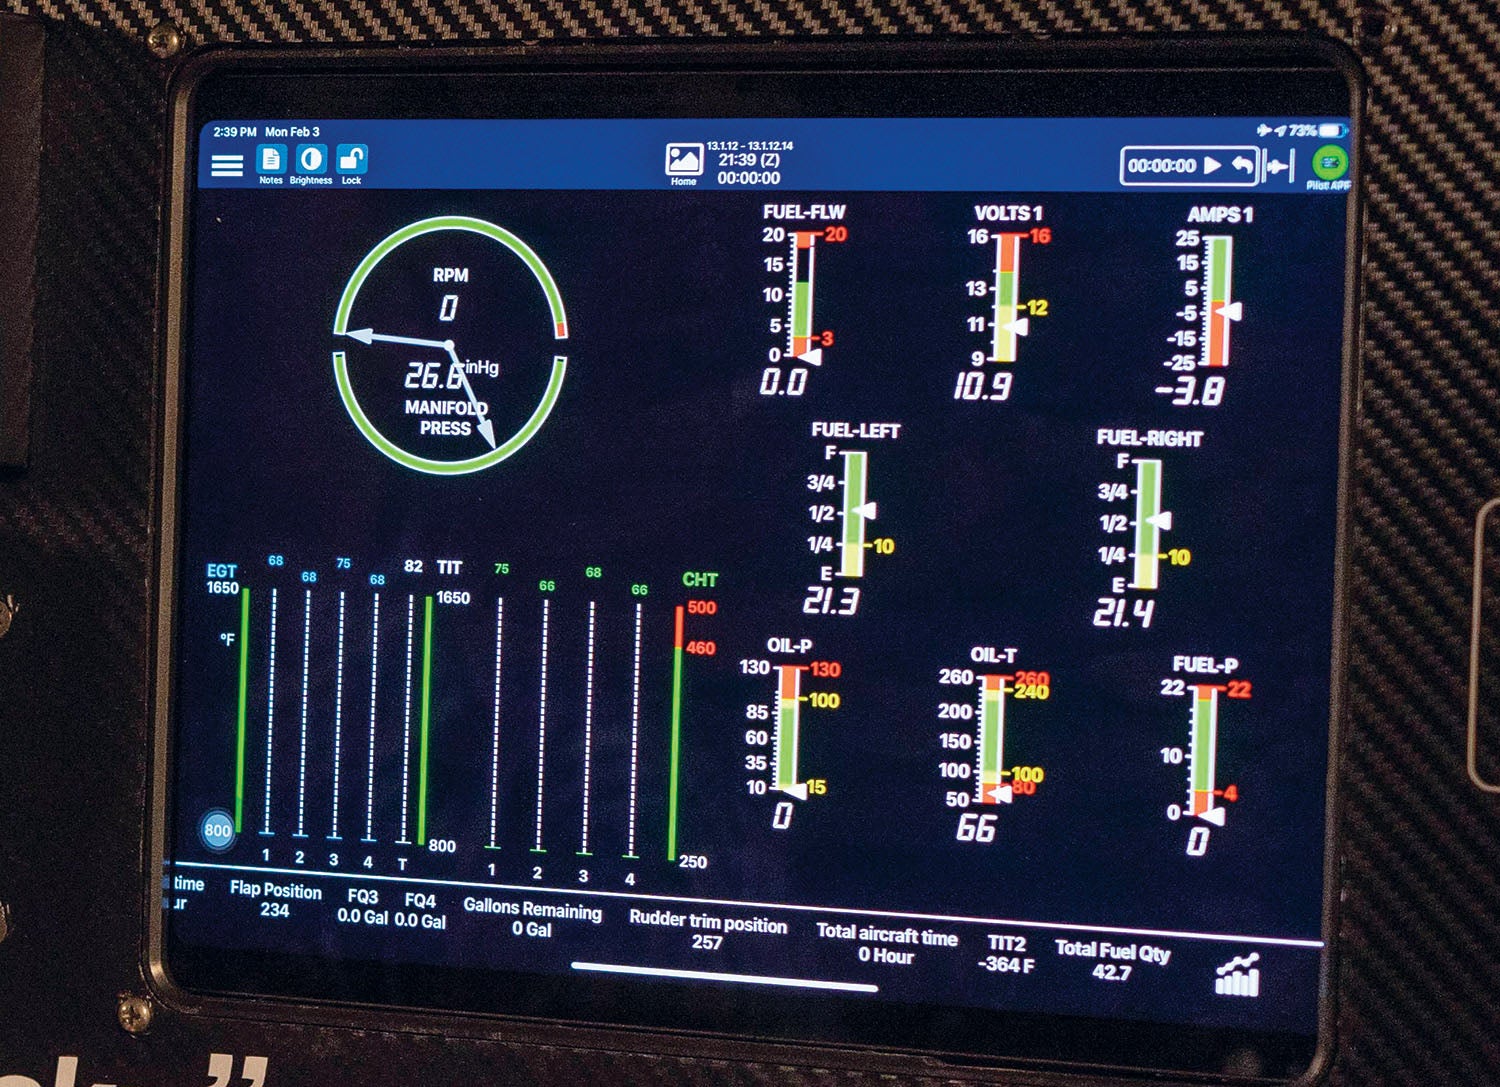
Worth mentioning for this roundup is the company’s $699 smartPlane EM100, which is an engine monitoring module that works with the company’s smartLink 851 flight data recorder for displaying a variety of flight data on an iPad. The way it works is the remote engine monitor connects via RS-232 to the smartLink device, which then connects to the iPad via a wired USB connection, plus the smartLink also has Bluetooth. The data is hosted by the Guardian smartMFD app for iOS, and when connected to the smartLink 851, the iPad receives the engine data and power for charging. The smartMFD app stores and uploads the captured data after each flight to your account on the Guardian Avionics smartData web app. Guardian makes a line of iPad panel docks for mounting the tablet on the panel, in addition to extension cables for mounting the iPad in other locations.
The EM100 engine module has three main connectors, and the system uses standard type-K probe inputs (Alcor 86252 probes, as an example) for up to six EGT, six CHT and three TIT inputs. There’s also oil temperature, oil pressure, fuel pressure, fuel flow, fuel quantity, rpm and manifold pressure sensors, all sourced by the installer from parts retailers. The EM100 uses the Electronics International fuel flow transducer for fuel data.
You don’t need to use the EM100 for this tablet engine display interface. The smart-Link can connect with third-party engine monitors, including the JPI color series and the integrated Garmin G3X/Touch. The smartLink also has EFIS and GPS interfaces with a variety of third-party systems. We’ll look at the smartLink concept in depth in a separate article.
Standalone Engine Monitors
| Price with Basic 4-Cyl Lycoming Probe Pkg. |
Display (in) | Mtg. Hole (in) |
EGT/ CHT Chan. |
Eng. Spd. | Man. Prs. | Oil Prs. | Oil Tmp. | Fuel Flow | Fuel Lvl. | Data Link | Data Log. | |
|---|---|---|---|---|---|---|---|---|---|---|---|---|
| Dynon | ||||||||||||
| EMS-D10 | $2490 | 4.3 color |
3-1/8 | 4-6 | Y | Y | Y | Y | Y | Y | Y RS-232 |
N |
| Electronics International | ||||||||||||
| CGR-30P Basic | $3696 | 3.0 color |
3-1/8 | 4-6 | Y | Y | N | N | Y | N | Y RS-232 |
Y |
| CGR-30P Premium | $4417 | 3.0 color |
3-1/8 | 4-6 | Y | Y | Y | Y | Y | Y | Y RS-232 |
Y |
| MVP-50P | $5480 | 5.7 color |
5.5x 5.1x 2.4 |
4-6 | Y | Y | Y | Y | Y | Y | Y RS-232 |
Y |
| UBG-16 | $1648 | 2.0 LED |
2-1/4 | 4-6 | Y | Y | Y | Y | Y | Y | Y RS-232 |
Y |
| Grand Rapids | ||||||||||||
| EIS | $410 | 2.0×3.0 dot matrix |
5.13 x2.6 |
2-9 | Y | Y | Y | Y | Y | Y | Y RS-232 |
|
| Guardian Avionics | ||||||||||||
| EM100 | $699/1999 (no probes) | iPad | remote | 4-6 | Y | Y | Y | Y | Y | Y | Y RS-232 |
Y |
| Insight | ||||||||||||
| G1 | $1485 | 2.0 color |
2-1/4 | 4-6 | N | N | N | N | N | N | N | Y |
| G2 | $2093 | 2.0 color |
2-1/4 | 4-6 | N | N | N | N | Y | N | Y RS-232 |
Y |
| G3 | $3185 | 2.0 color |
2-1/4 | 4-6 | Y | Y | Y | Y | Y | N | Y RS-232 |
Y |
| G4 | $3998 | 3.0 color |
3-1/8 | 4-6 | Y | Y | Y | Y | Y | N | Y RS-232 |
Y |
| JP Instruments | ||||||||||||
| EDM-350 | $1200 | 3.0 color |
3-1/8 | 4-6 | Opt. | Opt. | Opt. | Opt. | Opt. | Opt. | Y RS-232 |
Y |
| EDM-740 | $3100 | 4.0 color |
3-1/8 | 4-6 | Y | Y | Y | Y | Y | Y | Y RS-232 |
Y |
| EDM-930 | $6100 | 5.0 color |
6×4.5 | 4-6 | Y | Y | Y | Y | Y | Y | Y RS-232 |
Y |
| MGL Avionics | ||||||||||||
| Xtreme EMS | $1690 | 4.3 color |
3-1/8 | 4-6 | Y | Y | Y | Y | Y | Y | Y RS-232 |
Y |
Conclusion
If we had to pick a flagship standalone monitor, it would be the Electronics International MVP-50P. It has a large screen, a rich user interface and does a lot more than monitoring the engine. Next would be the JPI EDM-350, which has a good reputation. For a more entry-level system we might consider the dirt-cheap and flexible GRT EIS mainly because it can operate standalone and connect with a GRT EFIS, making for a convenient interim installation. You might also consider the Dynon EMS, but the price differential to a basic SkyView with the engine-monitoring module is just too close. At that point, you should just take the leap.
Last, before committing to any engine display, price an integrated EFIS. For all but the most basic panels, we think it makes better sense. Even if it means the physical installation will be more challenging.
![[Credit: JetStream Rider]](https://www.kitplanes.com/wp-content/uploads/2026/04/AdobeStock_345999332.jpg?w=218&h=150&crop=1 "2026 Avionics and Lights Buyer’s Guide")
![[Credit: Dynon]](https://www.kitplanes.com/wp-content/uploads/2026/04/EMS-stand-alone_HDX.png?w=218&h=150&crop=1 "Dynon Unveils Scalable Engine Monitoring for Kitbuilders")


")


