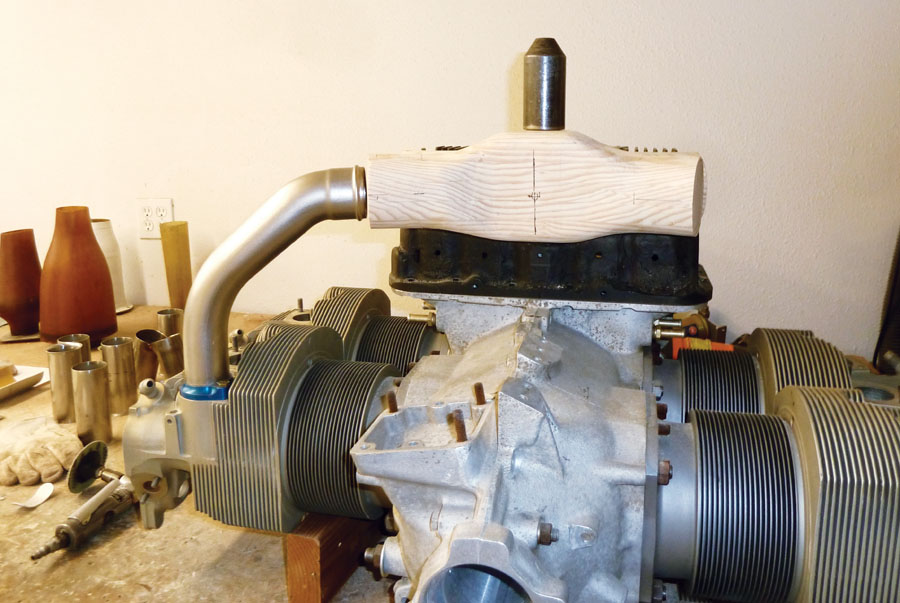
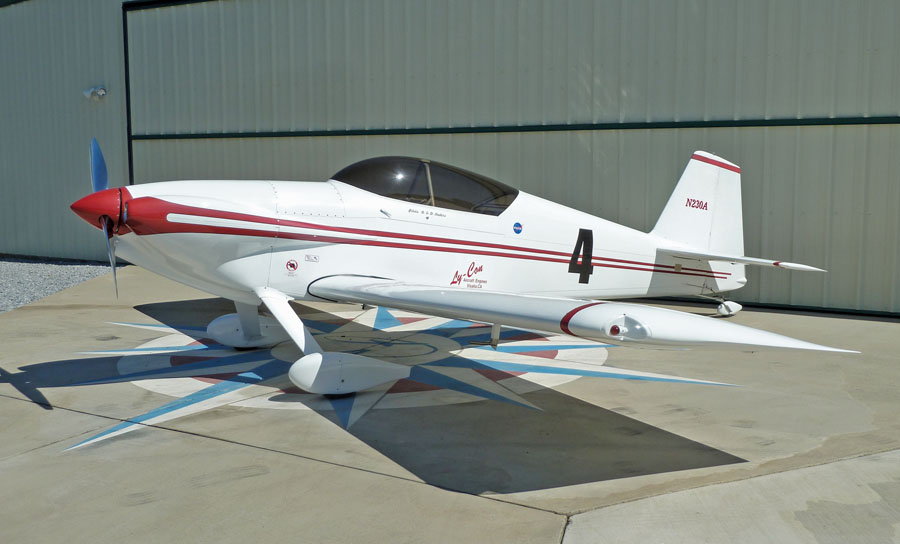
Designing a tuned and tunable induction by runner wave propagation. The laminated wood plug was used to make the mold for the plenum. The cylindrical object sitting on top of the plug is a weight to hold the plenum in position for fitting.
In previous articles in this series (October 2018 and May 2019), we covered things to consider when making intakes for our planes. For every 1-inch increase in manifold absolute pressure (MAP), we boost horsepower output approximately 2 hp per cylinder in a Lycoming 90-cubic-inch cylinder. So in a 360-cubic-inch engine, that’s around 8 or so hp. Some may think that seems like a lot. But remember those cylinders have 90 cubic inches each. Actually, that’s only an increase of about 0.022 hp per cubic inch.
Last time we talked about tuned induction systems and other ways to achieve greater volumetric efficiency (VE) than just Bernoulli’s + q (recovery of dynamic pressure), which increases hp directly from increased MAP. However, there may be an additional way to even do better to increase VE. Let’s take a look at induction wave propagation.
What’s Going On?
First I have to say that without great friends, I could not do this testing. I don’t possess the knowledge or skills necessary to do this on my own. Howard Claiborne, who is educated in—and has had a career in—wave propagation, is a pilot friend who is helping me with testing and deciding what we’re seeing in the runners. He is really smart.
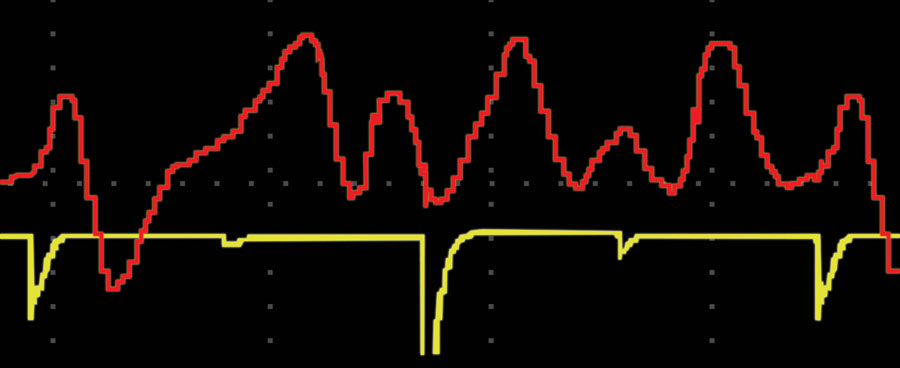
So what are we looking at? Figures 1, 2, and 3 represent what’s going on in the engine. Figure 4 is an oscilloscope trace that shows what’s happening in the intake runner. Figure 5 is an oscilloscope trace of what’s going on in the intake plenum with the red runner trace superimposed at the same time. When you put them all together, they show what’s happening in the engine during 720 degrees of crank rotation or one complete cycle for one cylinder.
Figure 1 shows the cylinder pressure versus crankshaft angle with the inlet and exhaust valve opening and closing events: IVO (intake valve opening), IVC (intake valve closing), EVO (exhaust valve opening) and EVC (exhaust valve closing).
Figure 2 illustrates the piston speed; note the piston is stationary at Top Dead Center (TDC) and Bottom Dead Center (BDC), while the maximum speed occurs halfway between.
Figure 3 shows the period of valve overlap where both the intake and exhaust valves are open simultaneously, and the intake valve position from open to close.
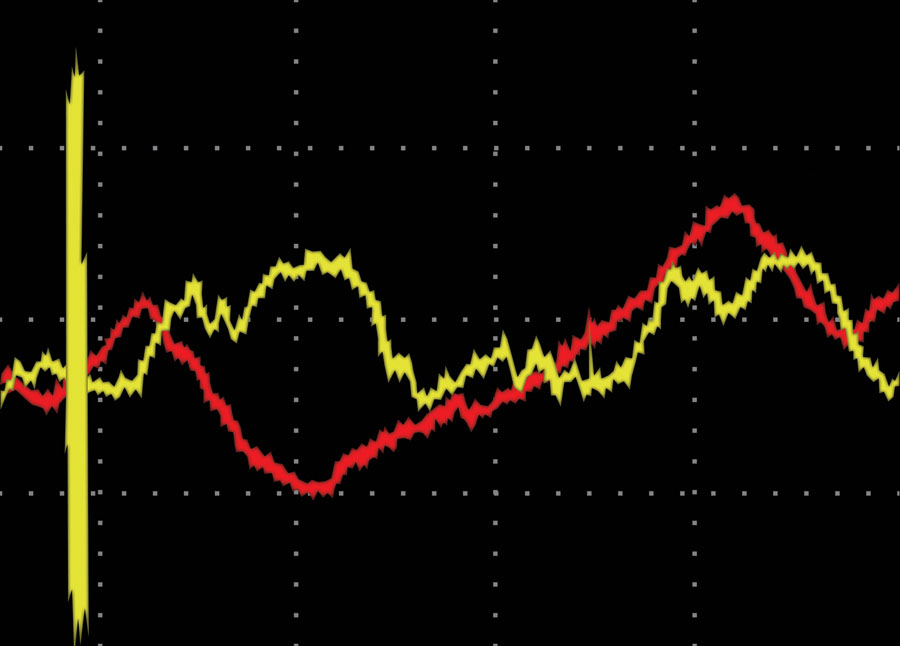
Figure 4 is an oscilloscope trace showing the pressure in the intake port at the cylinder head. This pressure, shown in red, is measured from the head primer port. The yellow trace is the ignition spark events, which allow correlation to the crankshaft position. At this rpm, the spark was at about 24.5 degrees before TDC. The small dips in the spark trace at BDC are electric interference from the spark on cylinders #3 and #4. The large yellow spikes on the far left and right of the graph at TDC are the wasted spark on cylinder #1 and the firing spark for cylinder #2.
Figure 5 is another oscilloscope trace showing inlet pressure at the cylinder head, again in red, and the pressure at the center of the intake manifold plenum in yellow. The yellow vertical lines are the spark, with the center of the graph as the trigger, and correspond to the spark events in the fourth graph. The same sensor is used in both locations, and their voltage readings have been calibrated to pressure. So we are able to read real pressure changes in both locations. We’ll come back to Figure 5 later.
Let’s assume we’re looking at #1 cylinder in Figure 4; the red peak points, from the left to the right side of the oscilloscope trace, show the #1 EVC, #1 IVC, #2 IVO, #3 IVC, #2 IVC, and #4 IVO. The #4 IVC and #3 IVO are hidden during the intake phase of #1 cylinder due to the sensor location being so close to the intake valve on cylinder #1. Then you can overlay the other cylinders 180 degrees apart for a four-cylinder engine, so a lot of things are going on simultaneously, all of which are making noise at their own frequency and time.
Each oscilloscope wave is a summary wave or a resultant wave of the algebraic sums of the frequencies of all the waves in the runner or plenum at the same time and location. The waves are slightly different in appearance because some of the waves’ locations in the runner vary with rpm and the speed of sound.
We already know about wave propagation in a practical sense. When a guitar is picked, we hear the wave as a note with the pitch dependent on the frequency of the string vibration. It dies out with time due to attenuation, but it takes a while. The wave propagates back and forth before the energy is gone.1 We know what happens when two waves of the same frequency and intensity are 180 degrees out of phase: We have noise canceling like our ANR headsets. We also know what a summary wave sounds like when we hear two engines on a plane out of synchronization. The sound varies in intensity, becoming louder and softer at the harmonic.
When you change engine rpm, the summary wave pattern changes as the number of round trips change due to the sound wave in the runner having a different amount of time to travel back and forth (due to the rpm change) from the valve to the plenum. That changes the sine wave position in the runner for the algebraic sums of the waves to produce the resultant pattern in our graph, so things can look a little different, but the basic things we are interested in are still there.
What’s Important?
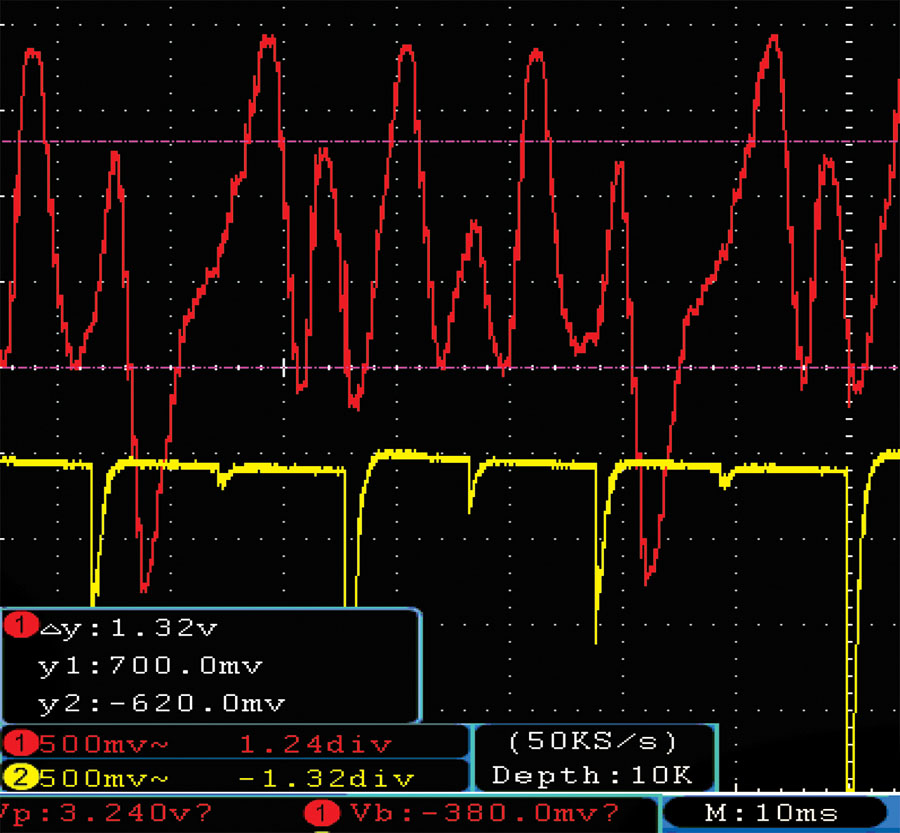
Figure 6 is a trace taken at M : 10ms (bottom right corner of the oscilloscope trace represents each division of the dotted lines, which are a duration of 10 milliseconds). Since there are 44.4 ms per 720 degrees of rotation, the engine speed during this trace was at 2700 rpm. This graph represents higher pressures at the top and lower pressures at the bottom, with the yellow line for timing.
In the October 2018 article, I mentioned that Vitek and Polasek2 did research on induction waves and concluded peak pressure in the runner just before the IVC was more important than pressure in the runner before the IVO. In our engines, because of the relatively low rpm, the best time for the wave to return back to the cylinder is between 30-50 degrees before the IVC. This will achieve the highest mean pressure at the right location in the runner, at exactly the right time, to produce the most complete and effective cylinder fill. (The exact timing required to produce peak runner pressure should be verifiable by the hp output on dyno runs or by changing the tunable runner lengths for max hp output to occur on sequential dyno runs at the same target rpm.)
Looking at Figure 6, you can see on the left side of the trace that as the intake valve opens (IVO), the pressure in the runner increases. This is because the piston is about 3/8-inch from TDC on its way to the top, and there is still about 6.876 cubic inches left to discharge on the exhaust stroke. (So a higher intake runner pressure waiting behind the valve at the right time as the IVO could be helpful in slightly decreasing the amount of backflow into the runner.) You can also see at TDC that the pressure in the runner is continuing to increase until nearer the EVC. At this point, the piston has begun to move down (but not much) and its velocity isn’t very high yet, but the intake runner pressure is still going up. So the exhaust flow (exhaust wave propagation) must be producing a high pressure at the exhaust valve and impairing the clearing of the remaining volume in the cylinder of gasses from the combustion cycle. This is undesirable, and at this rpm the exhaust pressure wave may be returning at the wrong time. (We may need a better exhaust system or different rpm to change the wave timing, but that’s a different project.3)
Then the cylinder filling starts and continues until IVC occurs, which is past BDC. During the first portion of the filling process, the rapid drop in runner pressure is from the piston moving down in the cylinder (remember the intake valve is open now). This allows the energy in the runner from MAP and mass flow kinetic energy to start into the cylinder for filling. You’ll notice that at the lowest runner pressure, the piston hasn’t reached maximum velocity yet, but the cylinder pressure is starting to increase. This is why things like runner diameter and taper in intake runner design is important. So at this point, the piston velocity is increasing and moving toward the bottom of the cylinder as the intake runner pressure continues increasing. And, at around maximum piston velocity, you can see that the runner pressure “matches” the same runner pressure that existed at the time the intake valve opened. This means from that piston position, the cylinder is no longer filling due only to piston function. The energy from MAP and the kinetic energy in the mass of the column of air flowing into the cylinder from the runner is responsible for cylinder filling until just beyond BDC. Then, that total energy of MAP and kinetic, plus the return of the propagation wave at the right time, around 40 or so degrees before the IVC (if we can harness it), is what is continuing to add to the total cylinder fill and increasing VE4.
I know this description may have been a bit tedious, but it helps us understand what we are trying to achieve.
In Figure 6, we’re at 2700 rpm and the timing is at 24.5 BTDC. We know the trace says 44.4 ms per 720, so that’s 16.216 degrees of crank rotation per ms, and TDC is 1.51 ms to the right of the primary spark. The spark timing is indicated by the yellow spike on the far right side of the trace; this way we can tell where events occur on a 720-degree rotational cycle of the engine.
For example, the #1 intake valve opened 22 ms before TDC and stayed open 13.3 ms.
13.3 ms x 16.216/ms = 216
That’s the effective intake cam duration (actually from about 0.050 inch after the IVO to 0.050 inch before the IVC). Also in about 1/2 ms or so, the intake valve completely closes—at least that’s the way the pressure waves in the runner see it. That leaves about 504 degrees for the intake valve to remain closed before the next IVO.
These are the two values that are important for wave timing. Say we need a wave returning at about 35 degrees before IVC and a returning wave just at the back face of the intake valve as it opens. So:
216 – 35/16.216/ms (at this rpm) = s
1. 11.15 ms total time for wave travel.
That’s when you’d like the pressure wave back to aid in cylinder filling at 35 degrees before the IVC.
Also, though less effective, the pressure wave should also arrive at the back face of the valve at IVO. So:
504/16.216ms/degree (at this rpm) = s
2. 31.08 ms total time for wave travel between IVC and IVO.
Why Tuned Runners?
If the induction temperature is about 140F in the runner, the speed of sound is about 1200 feet per second. At 2700 rpm, that equals 0.0444 seconds between the same valve openings (720 of crank rotation).
1200 feet per second x 12 inches/feet x .01115 second (the total time for wave travel) = 160.56 inches.
That’s the distance the wave travels between IVO to 35 before IVC (the most important runner pressure timing5). If an intake runner effective length is 16.1 inches long so a round trip of the wave is 32.2 inches, then:
1. 160.56 inches/32.2 inches per round trip = 4.99 trips
Wave distance between IVC and IVO is the second important runner pressure timing:
1200 feet per second x 12 inches/feet x 0.03108 second = 447.56 inches
2. 447.56 inches/32.2 inches per round trip = 13.9 trips
In this case, in the first example, the first set of waves caused by the IVO is back at the exact right time before the IVC in order to aid in cylinder filling. However, in the second example, the waves have gone to the plenum and are reflected back on their way to the valve with 13.9 total trips. The decimal “0.5” is the wave position when it is at the plenum and “0.0” is at the back face of the valve. So, 0.9 would be 80% of the distance back toward the valve from the plenum.
You can see that the length of the runner is very important to being able to tune the induction system. All you have to do to is change the length of the runner to 16 inches so the round trip total distance is 32 inches. Then:
447.56 inches/32 inches per round trip = 13.99 trips
That would be great for the maximum pressure in the runner as the IVO.
160.56 inches/32 inches per round trip = 5.018 trips
That wouldn’t be too bad either, so you can work out just what you want for your performance by adjusting your runner lengths for a specific target.
Pressures
Remember Figure 5, the oscilloscope trace that simultaneously compared the intake head port pressures to the plenum pressures? Both traces are with all the sounds of the other engine events occurring at the same time heard from different locations. The reason their traces look so different is because the magnitude of the sound waves from that head location overrides a lot of the frequencies that can be heard in the plenum from every cylinder. If you look at the plenum trace in yellow, you see every cylinder exhibiting a somewhat similar appearance because the sensor is in the center between all the cylinder inlets to the runners. So the yellow trace is the pressure events generated by every cylinder that the plenum sees.
You can also see pressure changes in the plenum due to the intake function during the engine cycle causing fluctuations in the highest to lowest pressures in the plenum. Then you can see the small pressure changes that are imposed on top of the trace. These are the sound waves in the runner reversing at the plenum of all the cylinders recorded from one location at the same time, so you have four sets of the sound waves of the runners transposed on each other. You also see that the pressure variations from each cylinder (the highest points of the yellow trace) don’t appear to be symmetrical. That’s because each of my current runners are different lengths; it’s not a tuned induction system.
These patterns repeat themselves every 720 degrees (all things being stable). What we want is exactly the same pattern (or nearly so) repeated over and over on all the runners to each cylinder. When we tune the runners by changing their lengths, the frequencies generated during wave propagation will become superimposed on top of each other. It should look less chaotic, the amplitude of the spikes should increase, and they should look more symmetrical. (At least, that’s what we hope will happen.)
Figure 7 shows head and plenum pressures. The oscilloscope voltage range was 1.35-1.55 volts. The highest pressure we see in the plenum is actually about 26.04 inches or 1.55 volts, which is above the indicated MAP on the Dynon engine monitoring system. The Dynon indicated 25 inches at 1.48 volts, and the lowest plenum pressure is at 23.1 inches or 1.35 volts. The pressure in the plenum is actually changing about 2.9 inches total, or plus and minus 1.45 inches of indicated MAP during the engine cycle.
The pressure fluctuations in the plenum may be able to be decreased by increasing the plenum volume. This should reduce the pressure drawdown ratio of the piston to plenum volume. This may slightly increase the lowest baseline pressure for the engine cycle and, according to some, it may also produce more torque. I need to add that these values have to be taken at wide-open throttle (WOT) as throttle position obviously affects the amount of drawdown in the plenum during each piston intake cycle. We’ll see what actually happens when we test the new plenum.
What’s Next?
Howard continues brainstorming on how to be able to use the information we are seeing to our benefit. We think (Howard grasped that idea first) that we’ll be able to adjust the runner lengths during a ground run-up, which should transpose the runner frequencies to be coincident using the FFT (fast Fourier transform) analysis while listening to the plenum. That would make the effective operational wave travel in each runner the same length. However, that would not “tune” the induction to a specific operational target (rpm). Howard believes that after we are able to make all the operational wave trips coincident in the runners, we’ll need to do an in-flight test (or possibly a dyno run), varying the rpm to reach the highest voltage on the head port sensor, which would be the highest pressure in the runner at the intake valve for that rpm. Howard says, “The rest is just math” to calculate the runner length necessary for the rpm performance target. Then we’ll need to adjust the runners on the ground to that length. Howard has already made a spreadsheet for performance target calculations.
During Howard’s career in seismology, he has shot jobs of over 500 square miles with over 1,000,000 source points, and in one job he shot 1,063,000 source points in 79 days. In contrast, we’re looking for sounds in about 1 square yard with 2 sensors. Did I mention he is a very bright electrical engineer?
Wouldn’t it be great if we could all have adjustable tunable runners to maximize the engine’s VE? That might not be that far off. I’m building one right now, and Howard and I will be testing it when it’s finished. When we know, you’ll know. Remember, without tuned runners the previous is not possible, and applying Helmholtz resonance isn’t either.
Appreciation
I would like to express a special thanks to Howard Claiborne for taking such a keen interest in this project. Without his help, this study would not be possible.
References
- Blair, G.P., 1999. “Design and Simulation of Four-Stroke Engines,”
Warrendale: SAE International. - Vitek, O. & Polasek, M., 2002. “Tuned Manifold Systems—Application of 1-D Pipe Model, SAE (2002-01-0004).
- Hiereth, H. & Prenninger, P., 2007. “Charging the Internal Combustion
Engine,” Springer Wien New York. - Ohata, A. & Ishida, Y., 1982. “Dynamic Inlet Pressure and Volumetric
Efficiency of Four Cycle Four Cylinder Engine,” SAE (820407). - Sammut, G. & Alkidas, A., 2007. “Relative Contributions of Intake and
Exhaust Tuning on SI Engine Breathing—A Computational Study,” SAE (2007-01-0492). - Khoo Aik Soon, 2014. “Simulation and Experimental Studies of Intake
and Exhaust Tuning for Automotive Engine Low-End Torque,” Universiti
Sains Malaysia. - Smith P. H. & Morrison J. C., 1971. “Scientific Design of Exhaust & Intake Systems,” Robert Bentley, Inc.










Nice clear article. Math is fun, but small errors and non ideal conditions ( ie. bent runners) can spoil the party. Impirical methods often can work well. Could you consider a method of using a temporary remotely tunable runner that is then tuned for a local maximum rpm (maximum power) near the target rpm. This tuned length could then be used for a permanent runner length without worry if it represented true peak power.
Regards,
Tim Dodd