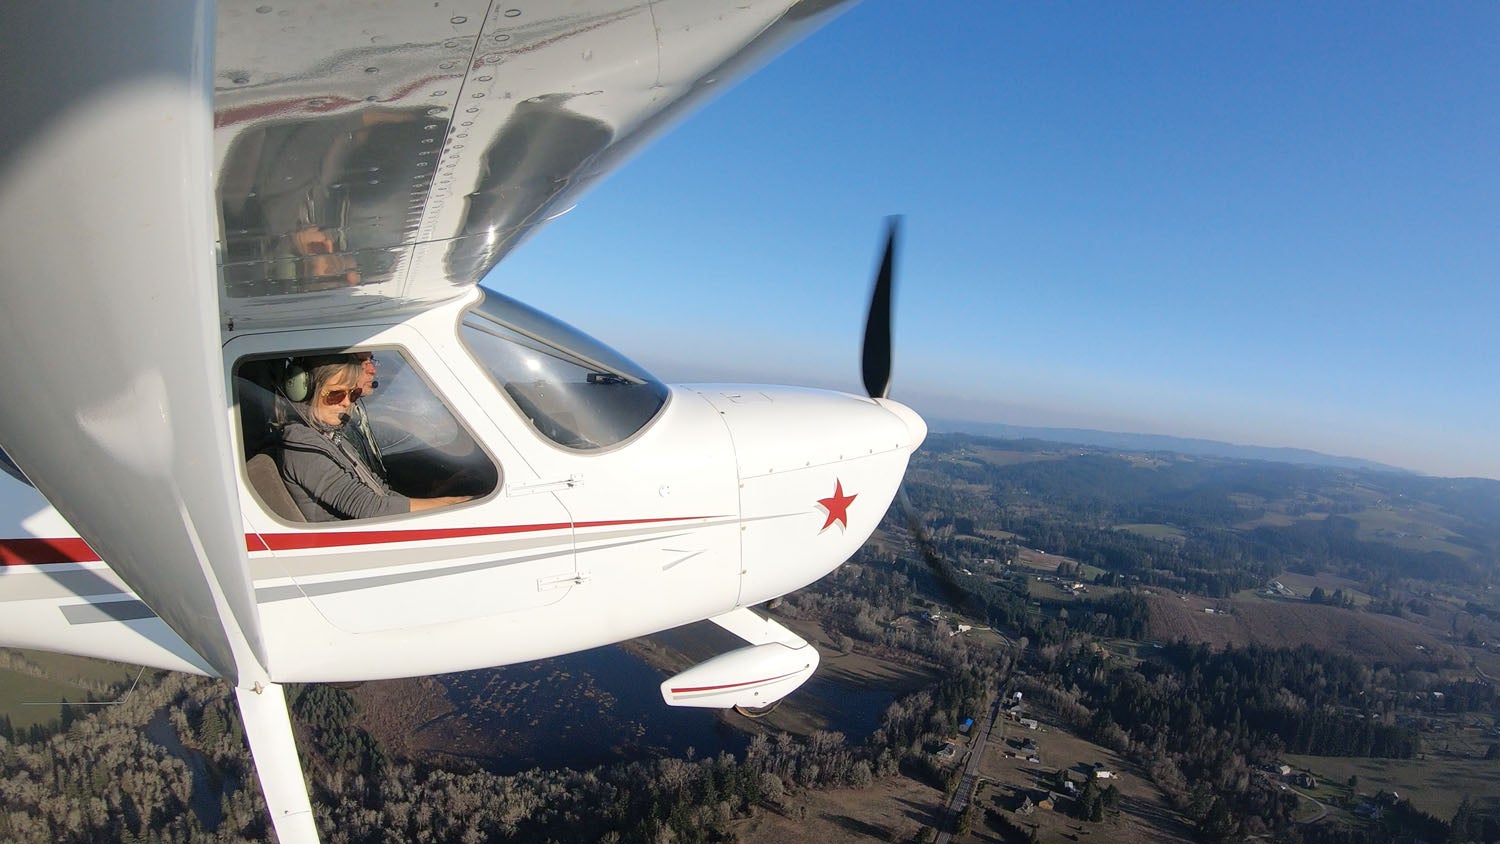
 We left this saga two issues ago after my GlaStar flew for the first time with the new Titan IO-340 engine that replaced a long-running but ultimately ready-to-retire Lycoming O-320. The day finally came when the fabricating was done and Charlie Echo (my nickname for the GlaStar) was ready to fly. And it did so spectacularly. The first flight was a success in ways big and small—the engine kept running the whole time, major indicators like oil pressure and temperature, as well as both cylinder-head and exhaust-gas temps (CHT/EGT) were where I more or less expected them to be. There were no loud bangs or shimmies, nothing vented into space—no reason to tell Houston we had a problem.
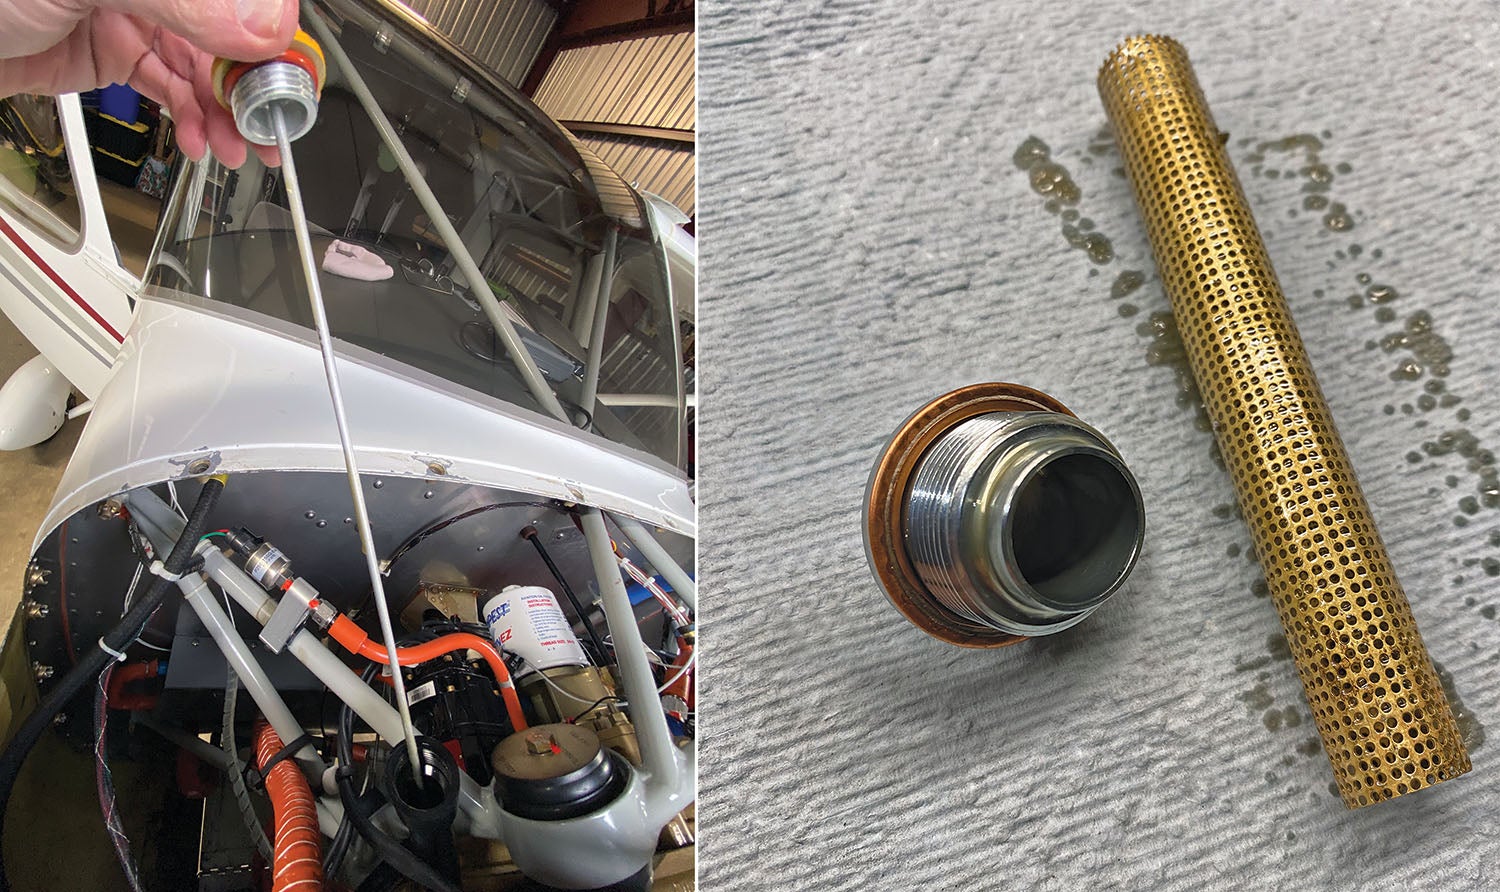
After the first flight was complete, I uncowled the engine and spent much time looking it over. At this stage, you’re on the hunt for leaks and parts touching that shouldn’t. But it’s also a good time to check all the safety-wired items and look closely at your wiring and plumbing. It’s amazing how many items can shift after the first flight, sometimes in ways that you don’t expect. I was surprised to see the alternator field wire slink its way toward a metal part, though it didn’t complete the trip.
Breaking In
Paul Dye gave us a thorough overview of the break-in process during his final “Renewal” segment last month, so I won’t belabor the concept here, only to say that you’re really just looking to run the engine hard enough to seat the rings to the cylinder walls without overheating them. Most conventional aircraft engines will run hot at first and then show a surprisingly large reduction in temps over a short period of time, and then stay there until the engine is worn out. So, two key indicators of break-in: a drop in observed CHT and a reduction in oil consumption, both signifiers that the rings and cylinder walls have become happily acquainted.
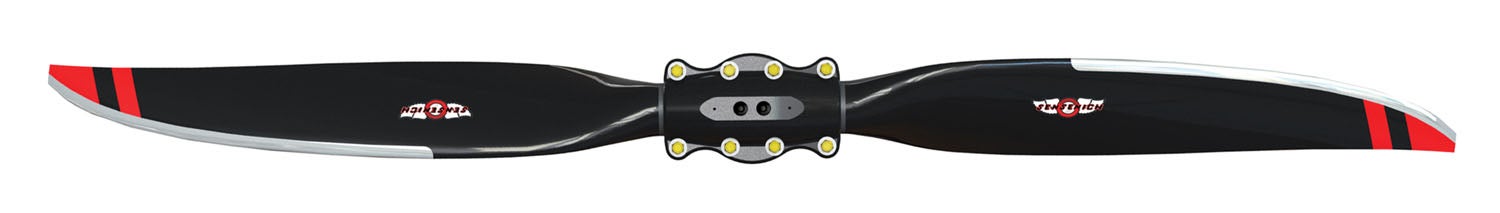
I had more variables in play, since the engine/prop combo was new and I didn’t know which cowl flap position would work for the first flights. The Sensenich fixed-pitch prop is easily ground adjustable to one of six settings, and I chose the baseline as recommended by Sensenich. It uses metal pins inserted into the hub to set pitch, and they’re numbered 2 through 7; the lower the number, the finer the pitch. Pitch #4 is the baseline.
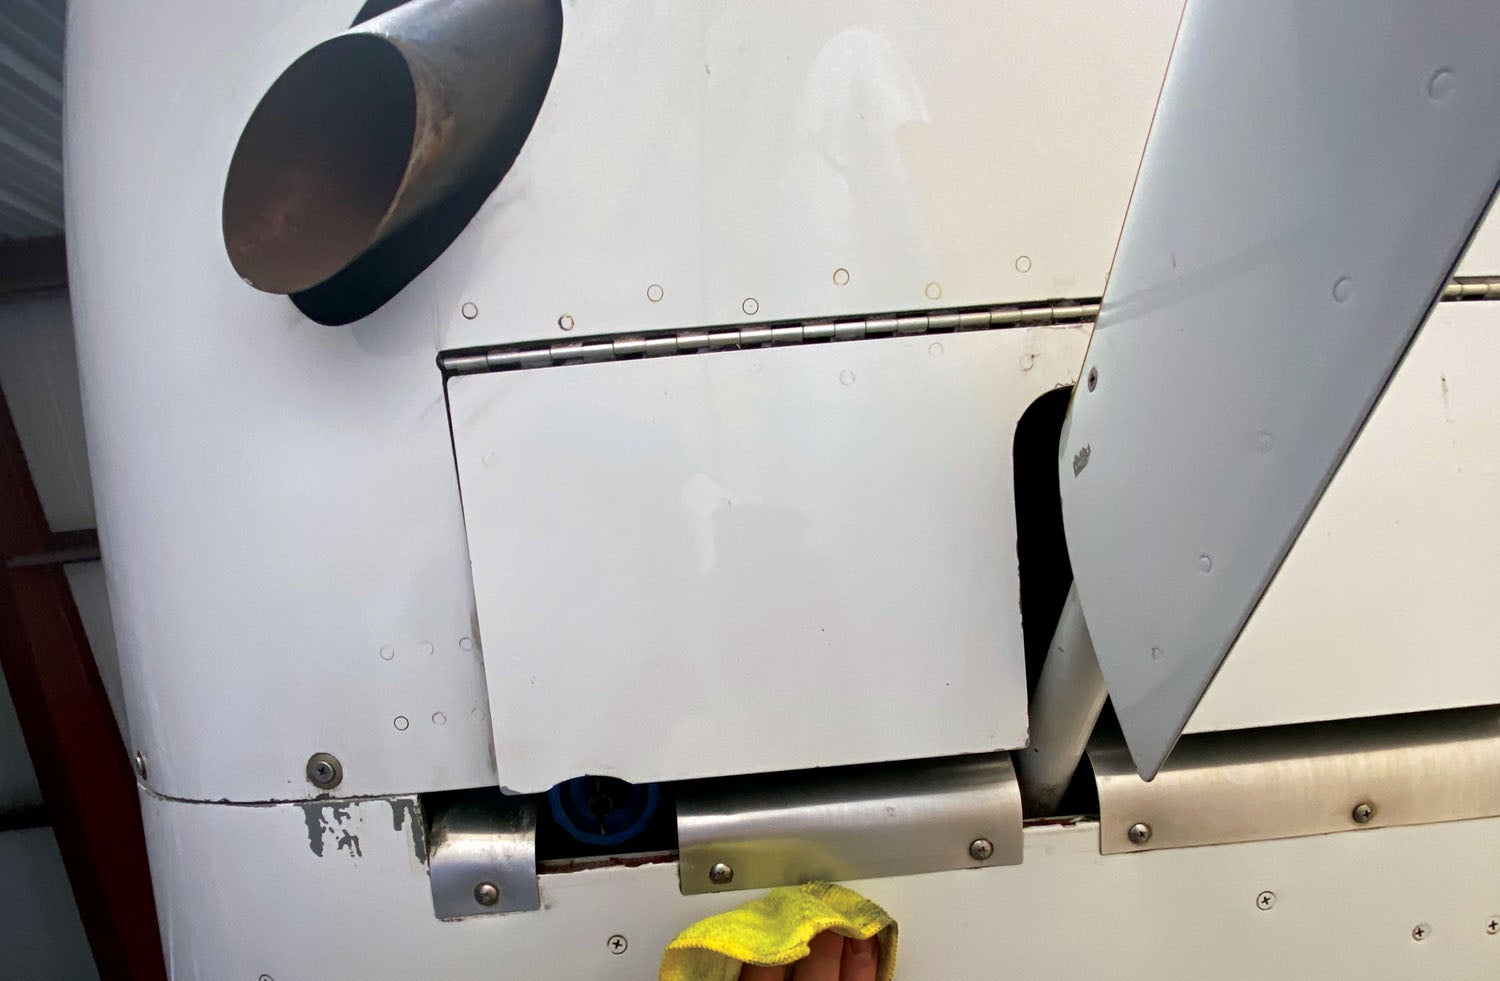
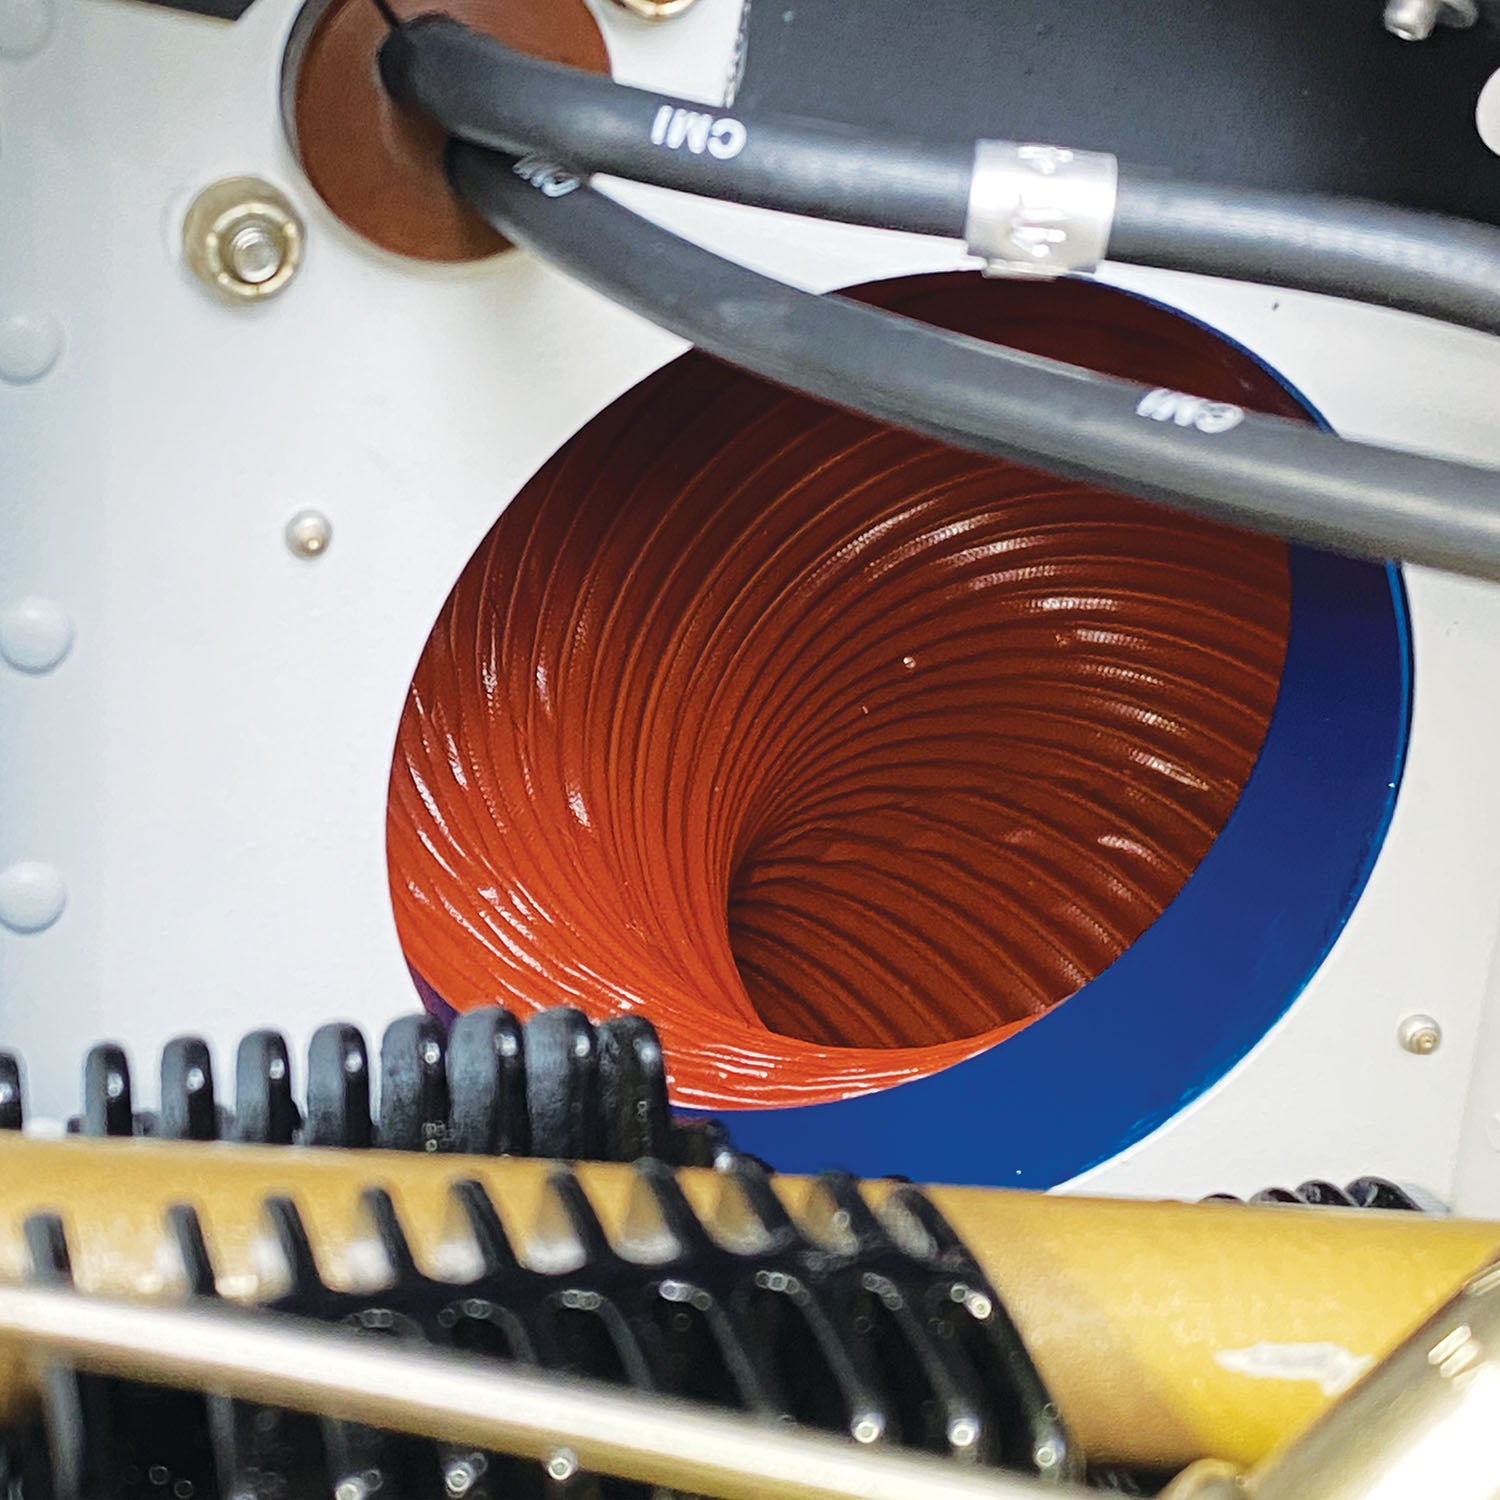
As for the cowl flap, I took a WAG and set it to the mid position. For clarity, the standard GlaStar cowl flap is ground adjustable, roughly 20 inches wide and 7 inches deep, opening a total of 18° from the flat portion of the bottom cowling. But “closed” isn’t really, since there’s still a sizable cutout for the nose-gear strut and the firewall flange is cut back from the trailing edge of the flap, leaving a gap for air to flow through.
I felt these settings were right to manage temps. The prop pitch, which I anticipated would be slightly too fine based on my experience with this prop on the O-320, would keep the engine from loading up as heavily, and that’s good to keep temps down. The cowl-flap setting was more open than I typically used on the O-320 during the winter months. But I also had 30 more horses, and that brings heat. So I took my best guess and looked forward to seeing the data later.
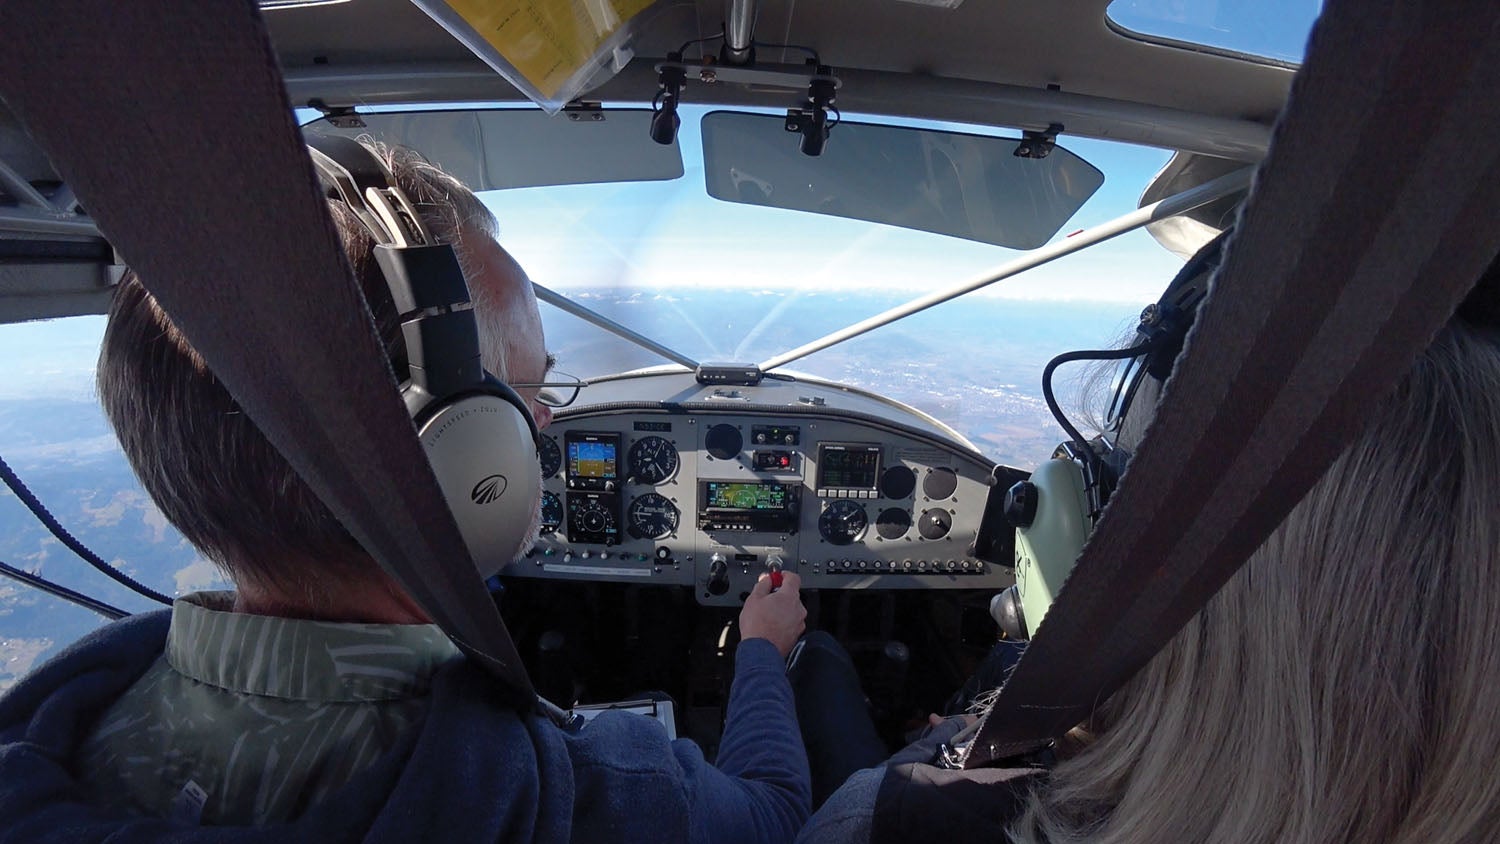
So how’d we do? Looking at the data logged by the Dynon EMS-D10, I could see that the first flight’s max CHT was 385°, briefly, with oil temps peaking at 191°. Better than I expected, but the temps in the descent fell off too rapidly. On the third flight, feeling like the engine could handle more prop, I reset to pitch #5, a coarser setting. If I encountered too-high temps in this configuration, I’d cut the flight short and land. Outside-air temps were around 40° F on the ground, so I knew I had some margin to play with. The third flight’s configuration put up more expected numbers: a peak of 394° for CHT in the climb and 208° for the oil.
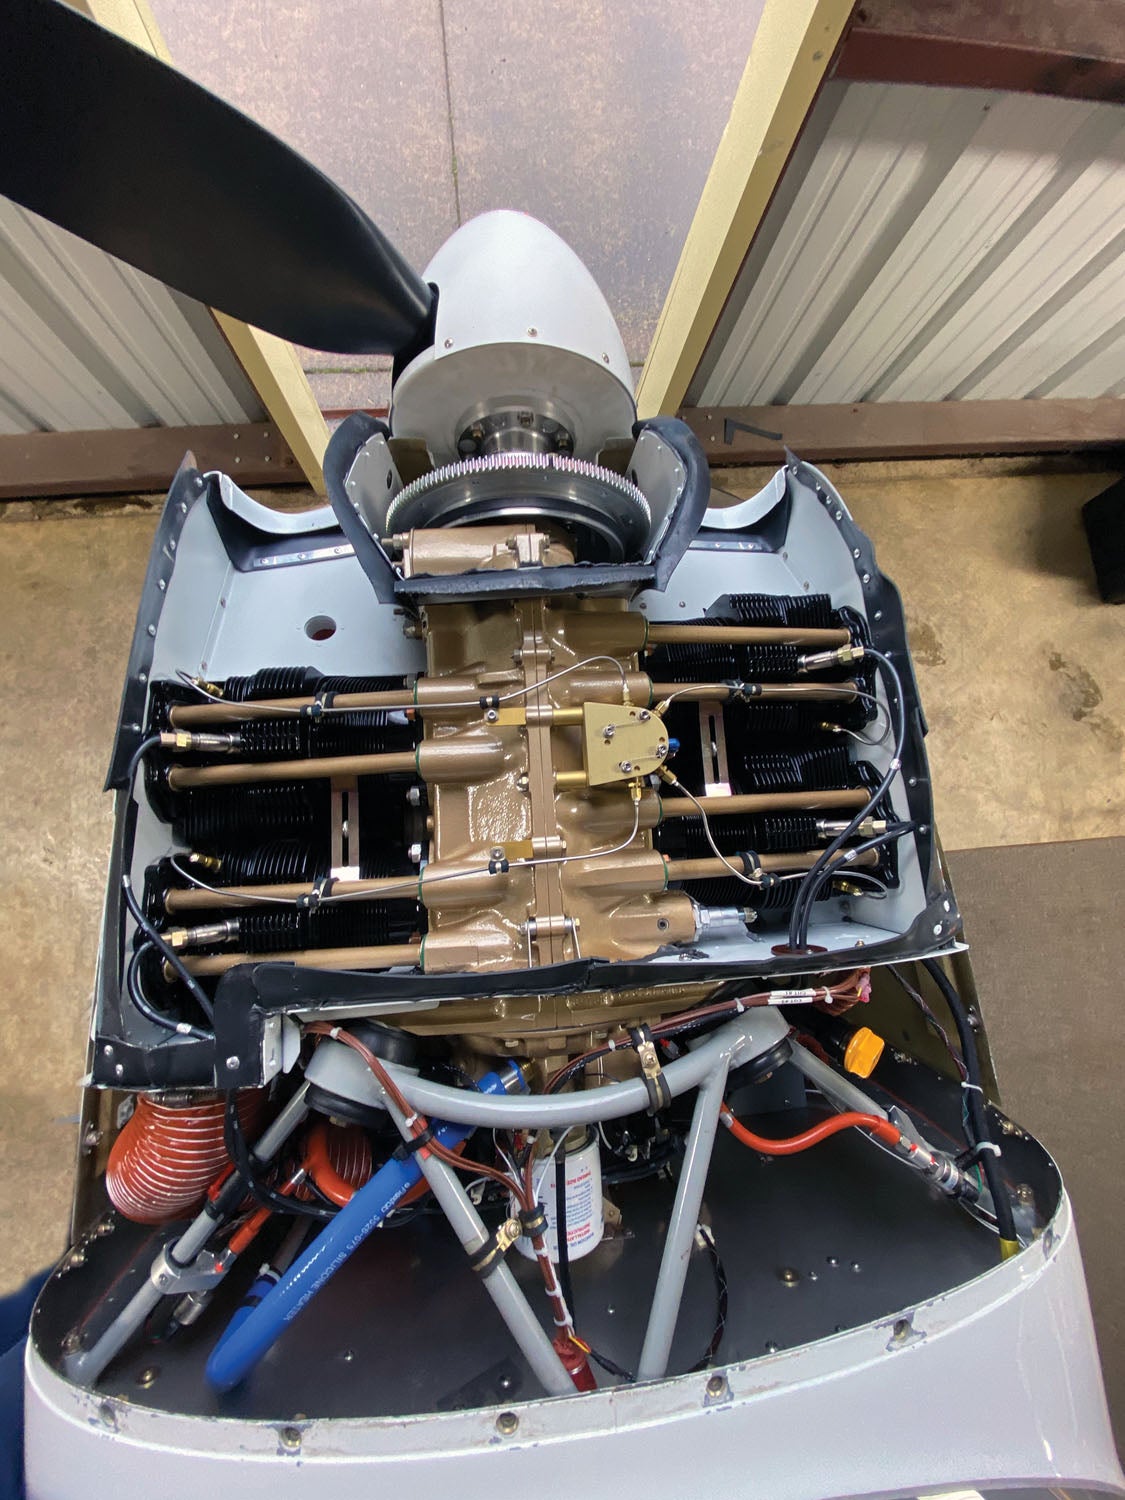
Break in? Sometime after the third flight, as far as I can tell. After that first flight with more pitch, CHTs and oil temp came down and stayed there. Oil consumed? Barely half a quart. I see variations in CHT in the data over the next few flights, but most of that was me fine-tuning the flexible baffling and filling in a few minor gaps in the fixed baffling to help bring the cylinders together. But the “big drop” was there. After 6 hours, I tested the airplane with the cowl flap completely closed, which resulted in slightly higher climb CHTs—and a movement of the hottest one from Cylinder 3 to 2—but I’ve been able to keep each under 400° at all times during our cooler months. This was actually better than I’d hoped for considering the extra power I’d added with the swap. Tweaks to the baffling continue to better group the CHTs. Never done!
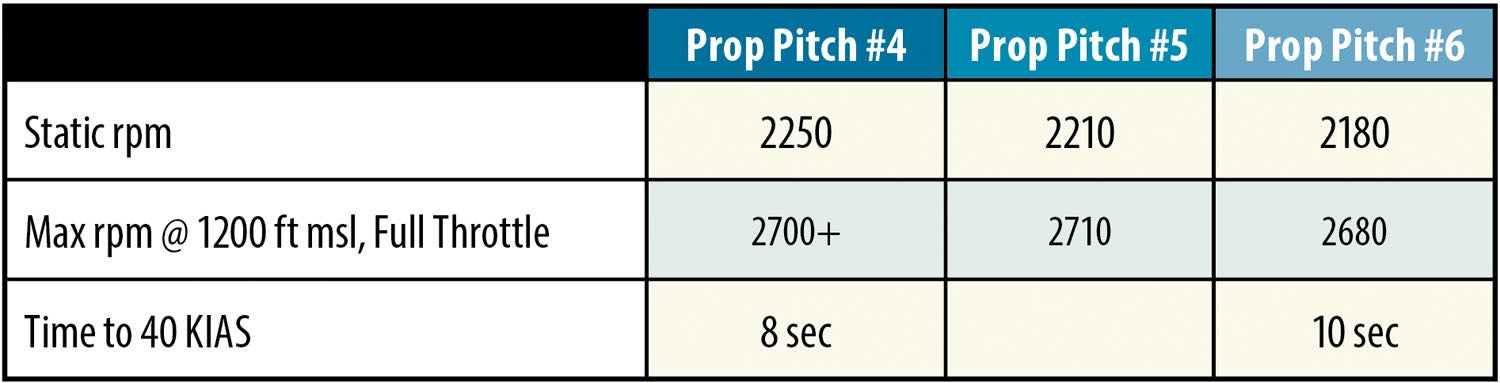
Table 1: Propeller Pitch Comparisons
More Flying, More Data
With the engine stabilized and all the new systems appearing to settle in nicely, I turned my attention to comparative performance testing with various prop pitches. Changing nothing else, I wanted to see how the three most likely prop settings on the Sensenich would perform.
A fixed-pitch prop is, of course, a compromise, so you need to consider several performance points as you choose a pitch setting. Sensenich recommends a static rpm between 2250 and 2350 but also suggests using a setting that just gets you max rpm (2700 for the IO-340) at full throttle and low altitude, basically max power. Over the course of a day, I was able to test the three most likely pitch settings back to back, with the same cabin load and with very nearly the same atmospheric conditions. (See Table 1, above.) My field is at 170 feet msl.
Essentially, the Sensenich at pitch #4 had the highest static rpm but well exceeded 2700 rpm at sea level; #5 had less static rpm but just overshot 2700 rpm down low with the throttle wide open; pitch #6 came up just 20 rpm shy of redline down low and had a static rpm of just 2180. At this stage, you could make a case for either of the two coarser pitch settings even if the expected static values were less than recommended. Accept the compromise.
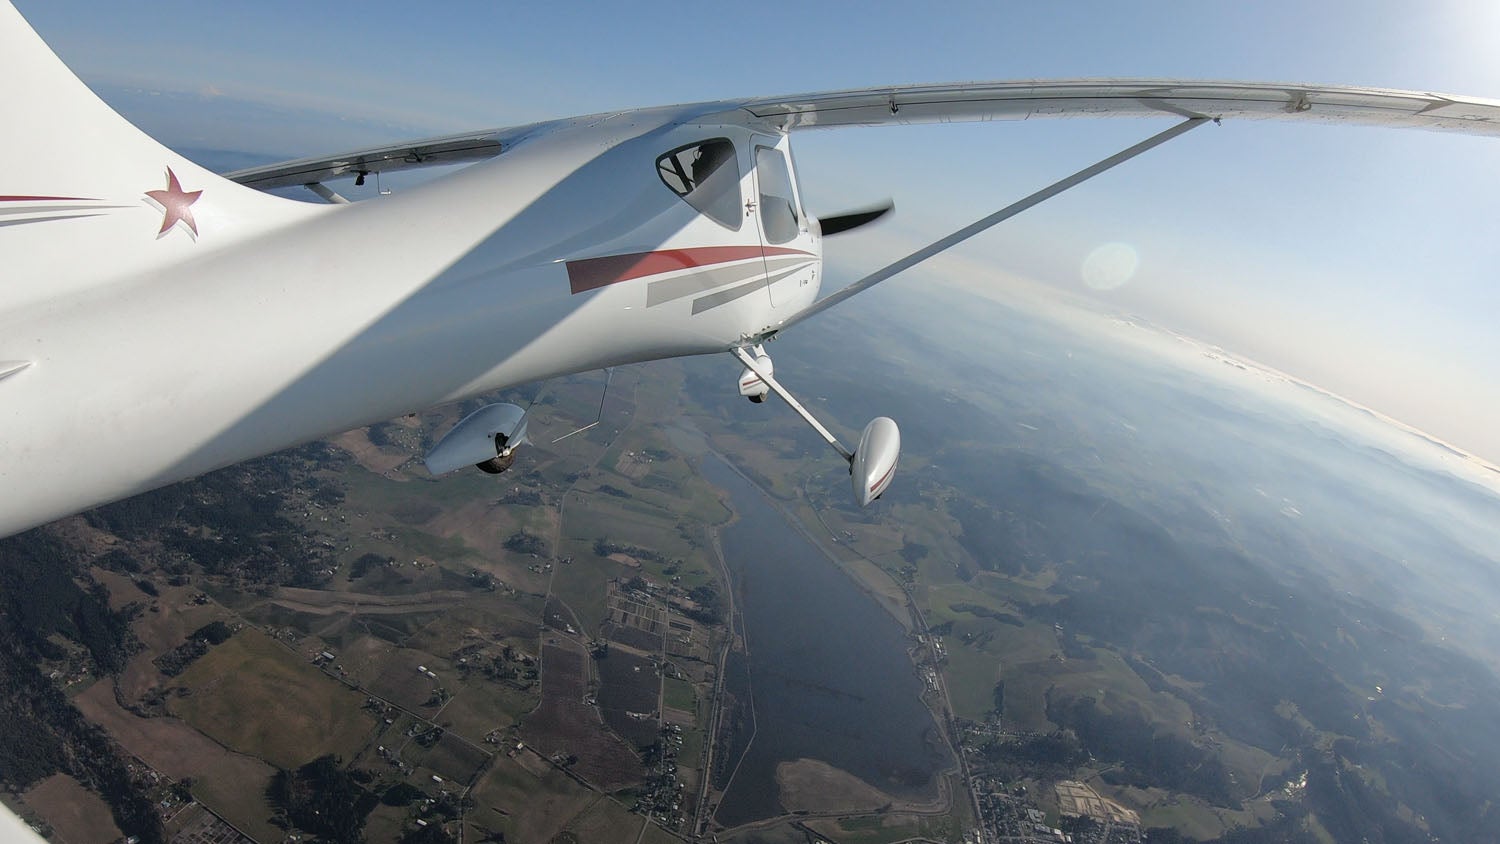
from the outside, but you can can feel
the performance from the pilot’s seat.
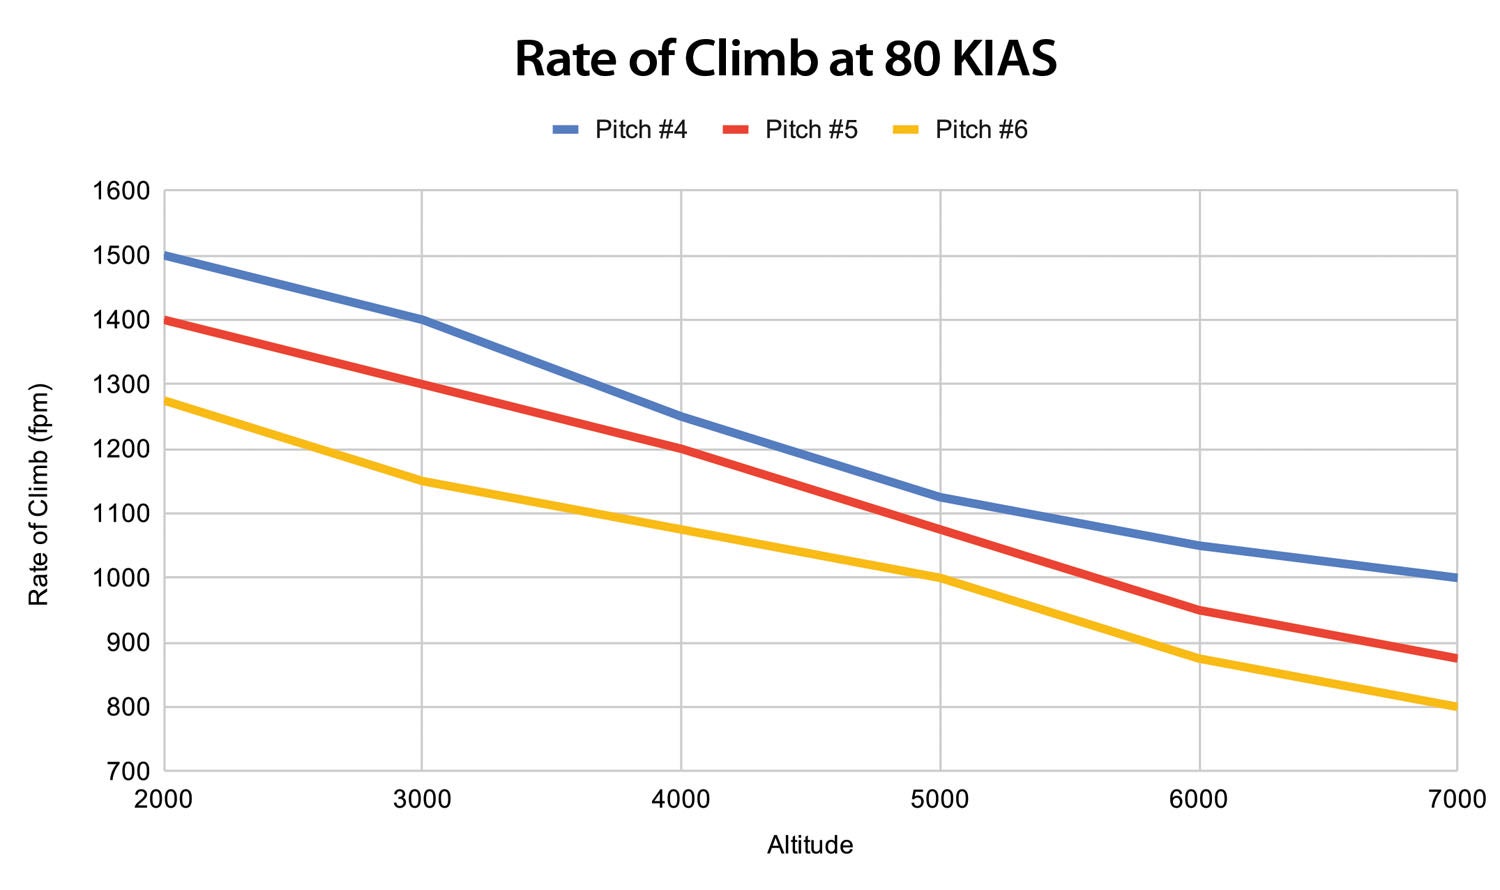
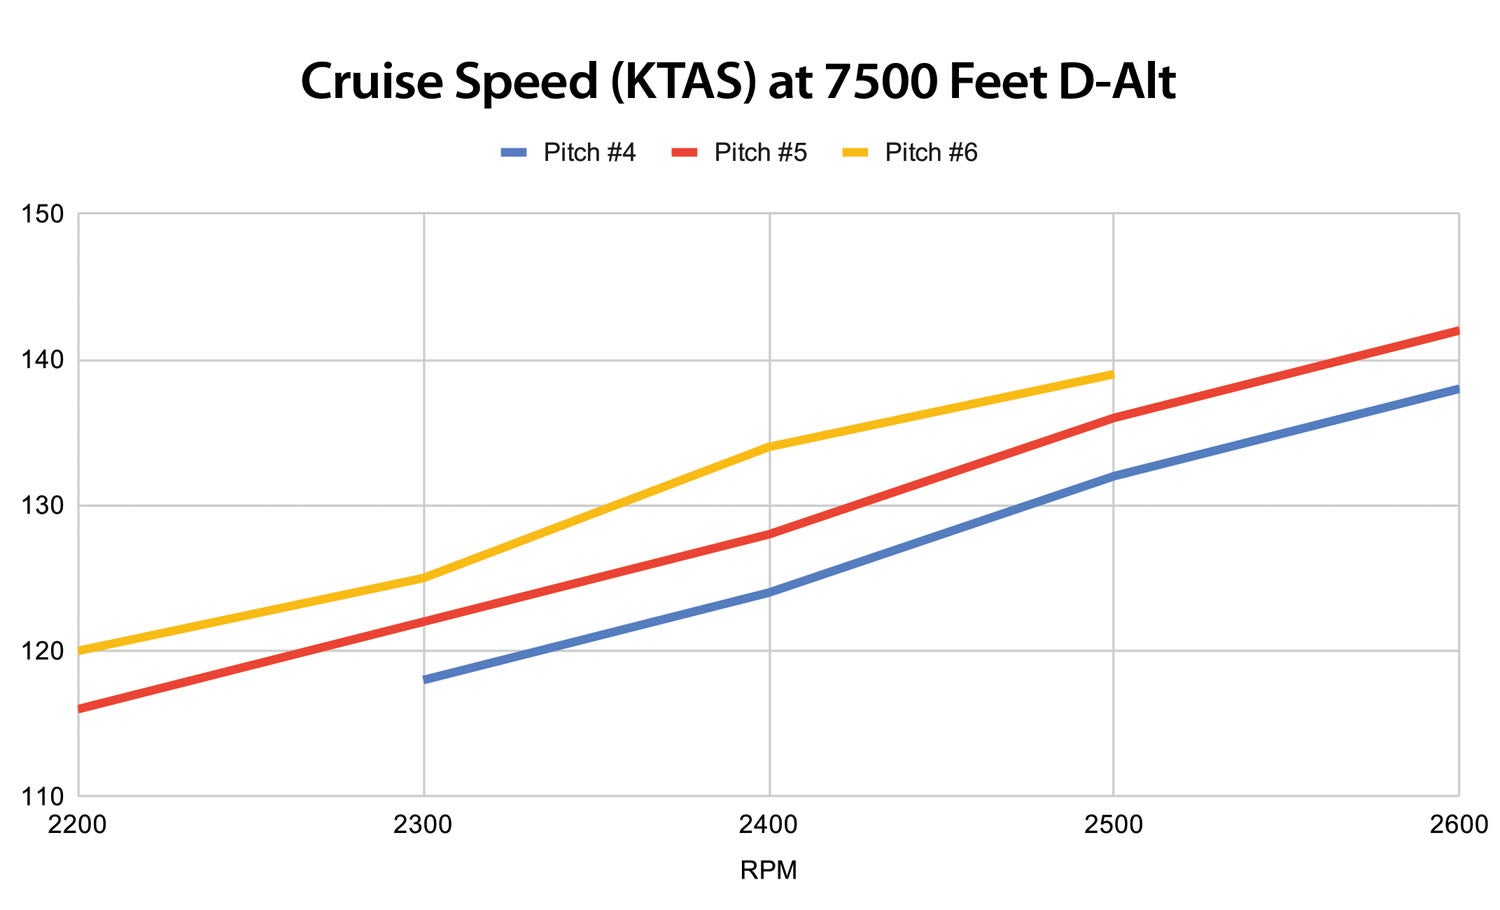
The GlaStar accelerated acceptably well and climbed strongly with each of the pitch settings, though it ascended more strongly with the finer-pitched prop, as you would imagine. (See Chart 1, above.) These tests were at the airframe’s best rate-of-climb speed of 80 KIAS (actual Vy is 78), and the performance differences are mostly the result of the engine spinning faster and making more power. I did notice on other flights that accelerating to 100 KIAS allowed the prop to unload further, and 2400–2450 rpm was possible on pitch #5, with just a small degradation in the rate of climb.
How’s the Speed?
Early in the flight testing, there were so many variables moving in different directions that I hesitated to put much stock on the performance readings. I was changing prop pitch, cooling drag and chasing fuel-flow accuracy by adjusting the K factor. With 18 hours on the new engine, it seemed like I might get consistent numbers.
Since you spend much of your time in cruise, at least if you’re going anywhere, it’s important to know what you’ve got. So the next set of tests compared performance on the three main pitch settings. Pitch #6 was first, followed by a reset to #4 and refilling the tanks, followed by #5, also on full tanks. Conditions were consistent, warming up only 5-7° F with a stable baro pressure throughout. I briefly wondered if I was still in the Pacific Northwest.
Table 2: Cruise Performance vs Prop Pitch
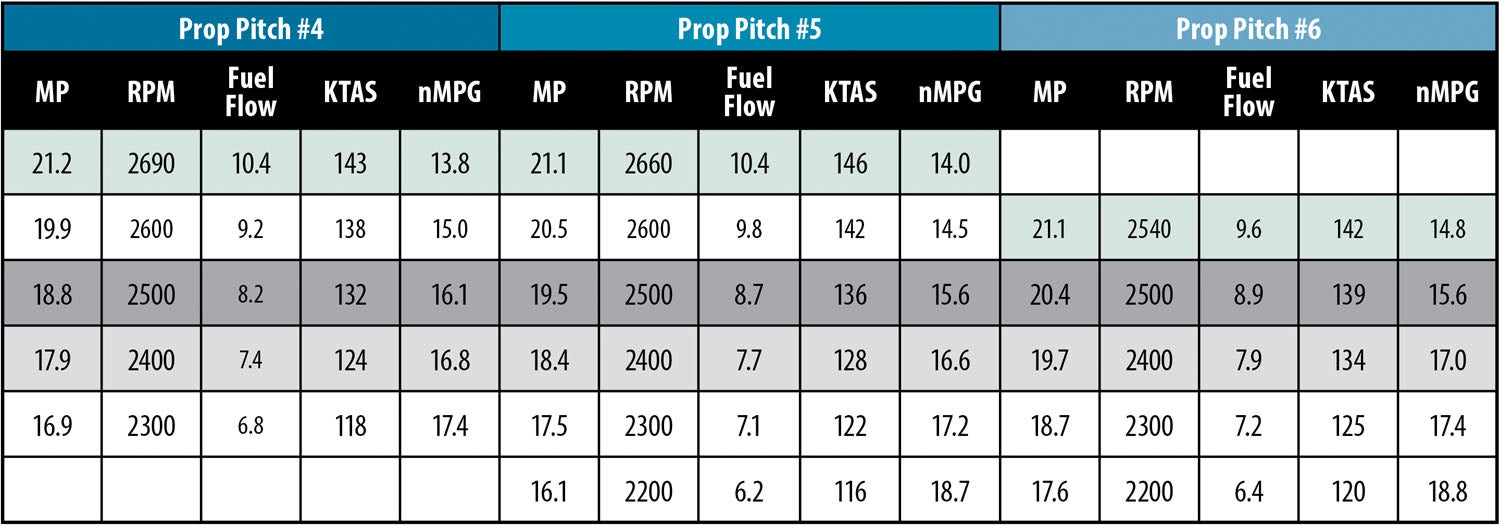
You can see the results of the cruise tests in Table 2, above. Note that I climbed to a pressure altitude that resulted in a density altitude of 7500 feet. I then went to full throttle and leaned for maximum rpm. From there, I simply reduced throttle to get the next rpm test point. I did not further refine the mixture during these steps, which means that at the lower power settings the mixture probably trended a bit rich. Also these are rich-of-peak EGT settings for sure, but at least they’re consistent from test to test. In flight, I noted the figures manually and, later, compared them to logged data from the Dynon and the Garmin G5 EFIS. (I also managed a lean-cycle test, which showed the engine willing to run smoothly down to 50° lean of peak EGT, and with a slight burble down at 60° lean, without even tweaking the fuel injectors.)
The numbers were largely as expected. With a finer-pitch setting (#4), the IO-340 could spin up to a given rpm with less manifold pressure and burned a little less gas doing go. However, it was also going slower, exactly as you’d expect with a finer prop. Physics, alas, still works. Obviously, the coarsest pitch I tested gave only 2540 rpm at full throttle and peak-rpm mixture, though it was as fast as the next-finest prop at 2600 rpm while burning less fuel. It’s clear from the numbers and, for that matter, the feel of the airplane, that the coarser prop was creating more thrust per rpm (at least in the range I tested) and the main issue is how much power is available to maintain engine speed. Equilibrium in action.
Footnotes Aplenty
This testing took place in the winter, with the cowl flap closed and lots of high-density air for the Titan to munch on. We’ll see how it does come summertime. I did a brief test a few weeks earlier on pitch #7 but it’s definitely too much for this engine/airframe combination. Even #6 seems to have a bit of aerodynamic cavitation on takeoff, but that’s just a subjective impression and could be an illusion.
Oil temps have not been an issue.
With the IO-340 turning the Sensenich at the #6 pitch setting, there’s not a lot of drag, and I found myself often landing from the downwind all the way through touchdown on idle power. Once, when I’d overshot the idle speed setting by a little, the GlaStar really didn’t want to land. Finer-pitch settings don’t do this, but even then this fixed-pitch prop does not act like a big, drag-heavy constant-speed job. Speaking of that, it’s taken me several hot starts to get the sequence right, something I’ve never really struggled with (either on an IO-390 or a Continental IO-470), but the 340-powered GlaStar gave me fits. The problem is the prop is so light that it has little inertia, so if your hot-start technique isn’t right on, there’s little assistance to keep the engine spinning to the next cycle where things might work out. A short prime, cracked throttle, mixture to idle cutoff and then crank—advancing the mixture once the engine begins to fire—seems to be the right way.
Bottom Line It, Man
It’s fair to ask if this was a good idea after all. Is the IO-340 in the GlaStar all it’s cracked up to be? So far the answer is an emphatic yes. The takeoff and initial climb performance far outstrips the O-320’s capabilities, and the cruise speeds are better with the same fuel flows as before. Or, I can do the same speeds on less fuel; that’s the result of a better prop with more pitch, a higher compression ratio for better thermal efficiency and fuel injection that allows me to get to the best mixture setting without having to use fuel to protect an outlying cylinder. As spring turns to summer here in Oregon, I’ll hang on with prop pitch #5 and grab even more data running lean-of-peak mixture settings to find the best set of compromises. At some point, I’ll add electronic ignition and, probably, a constant-speed propeller. But, for now, I think I’ll put the test card away and just do a little flying purely for fun.


As an Alaskan pilot I would have like to see a number like STATIC Thrust; ie, tie the tail to post with a spring scale. Full throttle, see how many pounds of pull. Repeat for those prop options.
Another interesting number would have been rate-of climb at a given airspeed, perhaps Best Rate of Climb, and again Best Angle of Climb.
After all, you can’t get to cruise is the airplane doesn’t accelerate fast, or clear the trees at the end!
Good points, Ramon. I was trying to hit the key performance parameters while testing three pitch settings on the same day. I will consider doing the static tests soon and, if I can get a day with really stable conditions, the multi-speed ROC tests as well. I knew I couldn’t do all of them initially.
On the article “Return to flight”, the statement that the CHT goes down after breaking in: this is also caused by the forming of a layer of coal on the inside of the cylinder head, taking care of insulation.
Thanks, Bart. I think you mean carbon deposits in the head, which I have not seen referenced in any of the resources I have in front of me, including John Schwaner’s book. I have seen the insides of cylinders with 5-10 hours on them, and they don’t have enough carbon deposit by that time, yet the CHTs have definitely fallen. Cylinder-wall wear-in is considered the primary reason for high CHTs during the initial hours of operation. That mechanism is well understood and is present in both these big-bore aircraft engines and in smaller piston engines (like motorcycles, with which I have a lot of experience.)
Yes, I mean carbon disposits, English is not my mother tongue. I noticed also higher CHT’s when only the head was overhauled with my VW engine. It is also logical.
Comments are closed.